
Category: Coding & Development

Tutorials, tips, and resources for developers and programmers at every skill level.

  • How to Automate Cloud Deployments with Ansible

    How to Automate Cloud Deployments with Ansible

    Why Manual Cloud Deployments Are Costing You Time and Money

    Automating cloud deployments with Ansible can cut deployment time by up to 80% while eliminating the human errors that cause costly outages. If you’re still manually provisioning servers, pushing code by hand, or relying on click-heavy cloud consoles to manage your infrastructure, you’re burning engineering hours that could be spent building better products. In 2026, infrastructure automation isn’t a luxury — it’s the baseline expectation for any team running serious workloads on AWS, Azure, Google Cloud, or hybrid environments.

    According to the 2025 State of DevOps Report by DORA, organizations that adopt infrastructure-as-code practices deploy 208 times more frequently and recover from failures 2,604 times faster than their low-performing counterparts. Ansible sits at the heart of this transformation for thousands of engineering teams because it’s agentless, uses plain YAML, and integrates cleanly with every major cloud provider. Whether you’re a solo developer managing a handful of droplets or a DevOps engineer handling multi-region production clusters, Ansible gives you a repeatable, auditable path from code commit to live infrastructure.

    This guide walks you through everything you need to know — from first-time setup to writing production-grade playbooks, managing cloud inventories dynamically, and integrating Ansible into a CI/CD pipeline. By the end, you’ll have a clear roadmap for automating your own cloud deployments with confidence.

    Understanding Ansible’s Architecture Before You Write a Single Playbook

    Before diving into commands and YAML files, it’s worth spending five minutes understanding how Ansible actually works. This context will save you hours of debugging later and help you make smarter design decisions when your infrastructure grows.

    The Agentless Advantage

    Unlike Puppet or Chef, Ansible doesn’t require you to install any software on the machines it manages. It communicates with remote hosts over SSH (or WinRM for Windows) and pushes Python-based modules at execution time. Once a task is complete, those temporary files are removed. This architecture means zero agent maintenance, no persistent daemons to secure, and dramatically simpler onboarding for new team members.

    In cloud environments specifically, this matters enormously. When you’re spinning up ephemeral instances that live for hours before being terminated, you don’t want the overhead of registering agents, managing certificates, or maintaining a separate configuration management server. Ansible’s control node — typically your local machine or a CI runner — is the only persistent piece of infrastructure you need to manage.

    Core Building Blocks You Need to Know

    Ansible’s ecosystem has a handful of concepts that you’ll use constantly. Understanding them up front makes everything else click:

    • Inventory: A list of hosts Ansible manages. In cloud environments, this is usually dynamic — generated automatically from your cloud provider’s API rather than maintained as a static file.
    • Playbooks: YAML files that define what Ansible should do. They’re ordered lists of plays, where each play targets a group of hosts and runs a sequence of tasks.
    • Roles: Reusable, structured collections of tasks, variables, templates, and handlers. Roles are how you organize complex automation into modular, shareable components.
    • Modules: The actual units of work Ansible executes — installing packages, managing files, creating cloud resources, configuring services. Ansible ships with thousands of built-in modules and has dedicated collections for AWS, Azure, and GCP.
    • Collections: Packaged distributions of modules, roles, and plugins. The community.aws, azure.azcollection, and google.cloud collections are essential for cloud automation.

    According to Red Hat’s 2025 Ansible Automation Survey, over 67% of enterprise Ansible users manage multi-cloud environments, and the most common pain point before adopting Ansible was the inconsistency between manual deployment steps across different environments. Establishing a clear understanding of these building blocks solves that inconsistency at the architectural level.

    Setting Up Ansible for Cloud Automation the Right Way

    Getting Ansible installed is straightforward. Getting it configured correctly for cloud automation is where most beginners make mistakes. This section covers the setup process with cloud-specific best practices built in from the start.

    Installation and Environment Preparation

    In 2026, the recommended installation path for most teams is via pip inside a Python virtual environment. This isolates Ansible and its dependencies from your system Python, prevents version conflicts, and makes it easier to reproduce your toolchain in CI environments. Once your virtual environment is active, install ansible-core along with the cloud collection you need — such as amazon.aws for AWS, azure.azcollection for Microsoft Azure, or google.cloud for GCP. You’ll also need the corresponding Python SDK for your cloud provider: boto3 for AWS, the azure-identity and azure-mgmt packages for Azure, or google-cloud libraries for GCP.

    After installation, create a dedicated project directory structure. A clean structure separates your inventories, playbooks, roles, group variables, and host variables into logical folders. This discipline pays dividends when projects grow beyond a handful of playbooks and multiple team members need to navigate the codebase.

    Configuring Dynamic Inventory for Cloud Providers

    Static inventory files — where you list IP addresses or hostnames manually — are impractical for cloud deployments where instances are created and destroyed dynamically. Dynamic inventory solves this by querying your cloud provider’s API in real time to discover what’s currently running.

    For AWS, the amazon.aws collection includes the aws_ec2 inventory plugin. You configure it with a YAML file that specifies your AWS region, how to group hosts (by tags, instance type, VPC, or availability zone), and what variables to expose to your playbooks. When you run a playbook against this inventory, Ansible first calls the AWS API, builds a live picture of your fleet, and then targets exactly the hosts that match your criteria.

    This approach is particularly powerful when combined with AWS resource tags. Tagging your EC2 instances with environment=production, role=webserver, or project=checkout-service lets you write playbooks that target logical groups rather than hard-coded IP addresses. The same playbook works identically whether you have two production web servers or two hundred, without any modification.

    Azure and GCP have equivalent dynamic inventory plugins — azure_rm and gcp_compute respectively — with similar configuration patterns. If you run a multi-cloud environment, you can configure multiple inventory sources and Ansible will merge them into a unified host picture at runtime.

    Managing Credentials Securely

    Cloud credentials are the most sensitive data in your automation stack. Never hardcode them in playbooks, inventory files, or role variables. The correct approach depends on your environment: for local development, use your cloud provider’s CLI credential chain (AWS profiles, Azure CLI login, or gcloud auth). For CI/CD pipelines, use environment variables injected by your secrets manager — AWS Secrets Manager, Azure Key Vault, or HashiCorp Vault are common choices.

    Ansible Vault is your tool for encrypting any sensitive values that must live in your repository — API keys, database passwords, or certificate contents. You can encrypt individual variable values inline or encrypt entire variable files. The vault password itself should be stored outside the repository and injected at runtime, either via an environment variable or a password file referenced in your ansible.cfg configuration.

    Writing Production-Grade Playbooks for Cloud Deployments

    With your environment configured, it’s time to write playbooks that actually provision and configure cloud resources. This is where Ansible’s power becomes visceral — a few hundred lines of YAML can replace hours of clicking through cloud consoles.

    Provisioning Cloud Infrastructure

    Ansible’s cloud modules let you create, modify, and destroy cloud resources declaratively. Provisioning an EC2 instance involves specifying the AMI ID, instance type, subnet, security groups, key pair, and tags. Ansible handles the API calls, waits for the instance to reach a running state, and can immediately proceed to configure it — all in a single playbook run.

    The critical principle here is idempotency. Every Ansible module is designed to check the current state of a resource before acting. If the EC2 instance already exists with the correct configuration, Ansible reports it as unchanged and moves on. This means you can safely re-run your provisioning playbooks without fear of creating duplicate resources or overwriting intentional changes. Idempotency transforms playbooks from one-shot scripts into continuous reconciliation tools you can run repeatedly against live infrastructure.

    For more complex infrastructure — VPCs, load balancers, RDS instances, security groups, IAM roles — structure your playbook into logical phases: network layer first, security layer second, compute layer third, and application configuration last. Each phase should be a separate play or role, making it easy to run partial deployments when you only need to update one layer.

    Configuring Instances After Provisioning

    One of Ansible’s greatest strengths is the seamless transition from provisioning cloud resources to configuring what’s running on them. In the same playbook run, you can create an EC2 instance, add its new IP address to an in-memory inventory group, and then immediately run configuration tasks against it — installing packages, deploying application code, configuring systemd services, setting up monitoring agents, or applying security hardening baselines.

    Using roles for the configuration phase makes your playbooks dramatically more reusable. A webserver role that installs Nginx, deploys your application, and configures log shipping can be applied to freshly provisioned instances, existing instances during a rolling update, or even development VMs using the same YAML. This consistency across environments is what eliminates the classic “works on my machine” failure mode that plagues manual deployment processes.

    Handling Rolling Updates and Zero-Downtime Deployments

    Production deployments require more than just running tasks against all hosts simultaneously. Ansible’s serial keyword controls how many hosts are updated at a time — setting serial to 1 performs a one-at-a-time rolling update, while a percentage like 25% updates a quarter of your fleet simultaneously. Combined with Ansible’s built-in wait_for and uri modules to verify application health before proceeding, you can implement zero-downtime deployments entirely within your playbooks.

    For load-balanced environments, the pattern is to deregister each instance from the load balancer, apply updates, verify the application is healthy, and then re-register — all orchestrated by Ansible modules. AWS, Azure, and GCP all have dedicated Ansible modules for managing load balancer membership, making this pattern straightforward to implement without writing custom scripts.

    Integrating Ansible Into Your CI/CD Pipeline

    Running Ansible manually from a developer’s laptop is useful for learning and one-off tasks, but the real productivity gains come from integrating it into your continuous integration and continuous deployment pipeline. Automated, triggered deployments remove human bottlenecks and create an auditable record of every change to your infrastructure.

    Pipeline Architecture for Cloud Deployments

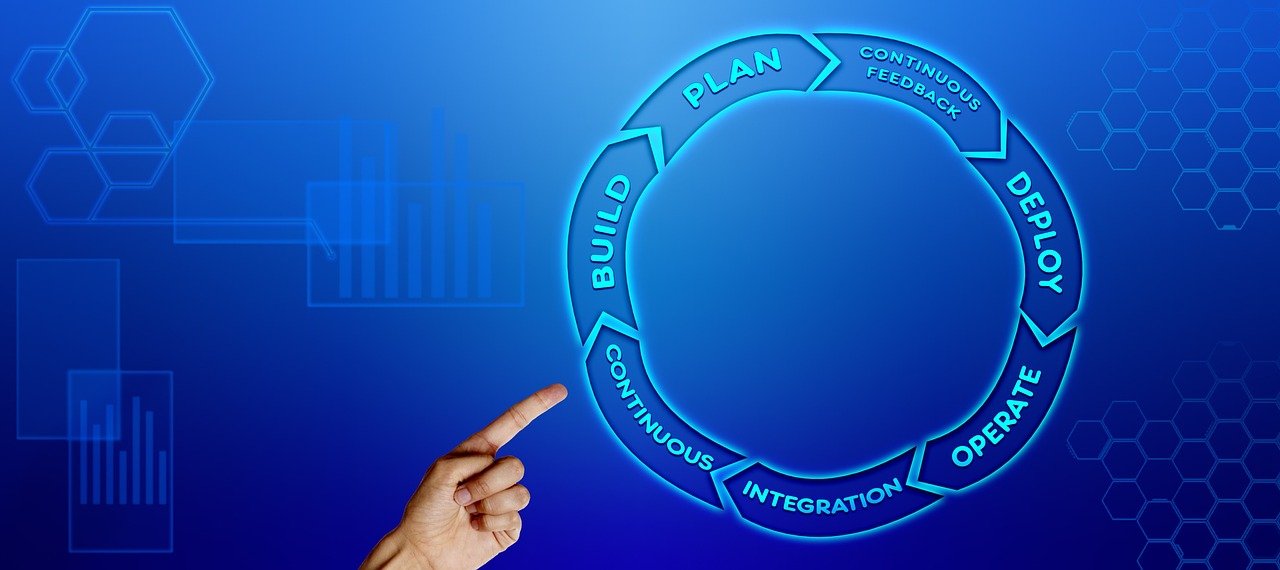
    A typical cloud deployment pipeline in 2026 looks like this: a developer merges code to the main branch, which triggers a CI job in GitHub Actions, GitLab CI, or Jenkins. The CI pipeline runs tests, builds artifacts, and on success, invokes an Ansible playbook to deploy to a staging environment. After automated smoke tests pass in staging, either a manual approval gate or an automated promotion triggers the production deployment playbook.

    To make this work cleanly, your Ansible project should live in the same Git repository as your application code, or in a dedicated infrastructure repository that your CI system checks out during deployment jobs. The Ansible control node in this setup is the CI runner itself — a clean, ephemeral environment for every deployment run, which eliminates the “snowflake control node” problem where automation behaves differently on different developers’ machines.

    Using Ansible Tower and AWX for Enterprise Scale

    Red Hat Ansible Automation Platform (formerly Ansible Tower) and its open-source equivalent AWX provide a web UI, REST API, role-based access control, and centralized logging on top of Ansible. In enterprise environments where multiple teams need to run automation with appropriate permissions — where a junior developer can deploy to staging but only a senior engineer can approve production — these tools provide the governance layer that raw Ansible lacks.

    AWX is particularly valuable for cloud automation because it integrates directly with cloud credential providers, supports dynamic inventory refresh schedules, and provides a complete audit trail of who ran which playbook against which infrastructure. For teams managing dozens of cloud accounts across multiple environments, this visibility is not optional — it’s essential for security compliance and incident response.

    Advanced Patterns and Troubleshooting for Reliable Cloud Automation

    Once you have basic automation working, a set of advanced patterns will significantly improve the reliability, maintainability, and performance of your cloud automation at scale.

    Testing Your Ansible Code

    Untested automation code is a liability. In cloud environments, a bug in a playbook can destroy production infrastructure in seconds. The Ansible testing ecosystem has matured significantly — Molecule is the standard framework for testing roles and playbooks, allowing you to spin up containers or cloud instances, run your automation, verify the results with automated tests, and tear everything down. Integrating Molecule tests into your CI pipeline means every change to your automation code is validated before it can affect real infrastructure.

    Ansible-lint catches style violations, deprecated syntax, and common mistakes before you even run a playbook. It’s fast enough to run as a pre-commit hook, catching issues in seconds rather than discovering them during a deployment to production. According to GitLab’s 2025 DevSecOps Survey, teams that implement infrastructure code testing reduce deployment-related incidents by an average of 43% compared to teams that skip automated testing for their infrastructure code.

    Performance Optimization for Large Inventories

    When your cloud inventory grows to hundreds or thousands of instances, default Ansible settings can make deployments painfully slow. Several optimizations make a dramatic difference: enabling SSH connection pipelining reduces the number of SSH connections per task; increasing the forks setting runs tasks against more hosts in parallel; using fact caching stores gathered facts between runs so you don’t re-query every host on every playbook run; and using async tasks for long-running operations prevents timeouts and allows parallel execution of independent work.

    For very large fleets, consider breaking your playbook runs into targeted executions using Ansible’s limit flag to deploy to specific host groups or individual hosts rather than your entire inventory. Combined with dynamic inventory tags, this lets you run surgical deployments to a single availability zone or instance type without modifying any playbook files.

    Common Pitfalls and How to Avoid Them

    The most common mistakes teams make when automating cloud deployments with Ansible are consistent and avoidable. Hardcoding environment-specific values directly in playbooks instead of using variables and group_vars creates brittle automation that breaks when you add a new environment. Ignoring error handling means a failed task silently leaves infrastructure in a partially configured state — always use block and rescue constructs for operations that need cleanup on failure. Running playbooks without first testing them against staging means production is your test environment, which is expensive and stressful. And not using version control for your Ansible code defeats the entire purpose of infrastructure-as-code.

    The antidote to all of these is discipline in project structure: every environment-specific value in variables, every playbook change tested in staging, every execution logged and auditable. Ansible makes all of this possible — but it requires intentional practice to build these habits into your team’s workflow.

    Frequently Asked Questions

    Do I need to know Python to use Ansible for cloud automation?

    You don’t need to write Python to use Ansible effectively. Playbooks are written in YAML, which is much more readable and accessible than a programming language. However, a basic understanding of Python is helpful when you need to write custom filters, debug module errors, or develop your own modules for non-standard tasks. For the vast majority of cloud automation use cases, YAML skills and familiarity with your cloud provider’s Ansible collection are sufficient to get serious work done.

    How does Ansible compare to Terraform for cloud deployments?

    Terraform and Ansible solve overlapping but distinct problems. Terraform excels at provisioning and managing cloud infrastructure state — it tracks what resources exist and handles dependencies between them with a purpose-built state management system. Ansible excels at configuration management and application deployment — once a server exists, Ansible configures what runs on it. Many teams use both together: Terraform to provision the infrastructure and Ansible to configure it. Ansible can provision cloud infrastructure too, but it lacks Terraform’s state management, which makes Terraform the better choice for complex multi-resource deployments with lots of dependencies.

    Is Ansible suitable for managing Kubernetes deployments?

    Yes, Ansible has solid Kubernetes support through the kubernetes.core collection. You can manage Kubernetes manifests, Helm chart deployments, namespaces, config maps, secrets, and cluster-level resources through Ansible playbooks. However, for teams deeply invested in Kubernetes, tools like Helm and ArgoCD offer more Kubernetes-native workflows. Ansible’s Kubernetes integration is most valuable when you’re already using Ansible for surrounding infrastructure and want a single automation tool rather than introducing additional tooling.

    How do I handle secrets and sensitive data in Ansible playbooks?

    The right approach has two layers. For secrets that need to live in your repository — internal configuration values, service credentials used during configuration — encrypt them with Ansible Vault. For cloud credentials used to authenticate to your cloud provider’s API, never store them in your repository at all. Use your cloud provider’s native credential chain for local development, and inject secrets via environment variables from a dedicated secrets manager like HashiCorp Vault, AWS Secrets Manager, or Azure Key Vault in CI/CD pipelines. Regularly rotate credentials and audit which pipelines and users have access to which secrets.

    Can Ansible automate multi-cloud deployments across AWS, Azure, and GCP simultaneously?

    Absolutely, and this is one of Ansible’s genuine strengths. Because Ansible uses provider-specific collections rather than a single abstraction layer, you can write playbooks that target AWS resources, Azure resources, and GCP resources in the same run. Dynamic inventory supports multiple cloud sources simultaneously, merging them into a unified host picture. This is particularly useful for organizations running workloads in multiple clouds for redundancy, regulatory compliance, or because different business units have different cloud preferences. The tradeoff is that you need to learn each provider’s collection and module syntax separately.

    What’s the best way to structure an Ansible project for a growing team?

    Use the official Ansible best practices directory structure from day one, even if your project starts small. Keep inventories separate per environment (development, staging, production) with shared group variables. Use roles for all non-trivial configuration tasks and store them in a roles directory or manage them via Ansible Galaxy requirements files. Use a dedicated vars directory with vault-encrypted files for sensitive values. Document your roles with README files that explain what each role does, what variables it expects, and what cloud resources it assumes exist. Version-pin your collection dependencies in a requirements.yml file so your automation produces consistent results across different machines and over time.

    How long does it typically take to learn Ansible for cloud automation?

    With dedicated practice, most developers with basic Linux and cloud experience can write functional playbooks for cloud provisioning within one to two weeks. Getting comfortable with roles, dynamic inventory, and CI/CD integration typically takes another two to four weeks of hands-on work. Mastering advanced patterns — testing with Molecule, performance tuning for large inventories, complex error handling — is an ongoing process that develops naturally as you tackle real-world problems. The investment is well worth it: according to Red Hat’s automation data, teams with mature Ansible practices report saving an average of 3.5 hours per engineer per week compared to manual infrastructure management workflows.

    Automating cloud deployments with Ansible is one of the highest-leverage skills a developer or DevOps engineer can build in 2026. It transforms fragile, manual processes into reliable, repeatable systems that your entire team can understand, audit, and improve over time. Start with a single playbook that automates a task you currently do manually — maybe provisioning a development instance or deploying a staging update. Build from there, adding dynamic inventory, CI/CD integration, and testing as your confidence grows. The patterns covered in this guide give you a solid foundation; the rest comes from practice and iteration on real infrastructure challenges specific to your environment and team.

    This article is for informational purposes only. Always verify technical information and consult relevant professionals for specific advice regarding your infrastructure, security requirements, and cloud environment.

  • Zero Trust Security Model: How to Implement It in the Cloud

    Zero Trust Security Model: How to Implement It in the Cloud

    Cloud security breaches cost businesses an average of $4.88 million per incident in 2025, and the number one reason? Implicit trust inside the network perimeter. The Zero Trust security model flips that assumption entirely — and in 2026, it’s no longer optional for serious cloud deployments.

    Why the Old Perimeter Model No Longer Works

    For decades, enterprise security operated on a simple idea: build a strong wall around your network, and everything inside is safe. Trust was granted based on location — if you were inside the firewall, you were assumed to be legitimate. That model made sense when employees worked on-premises and data lived in physical data centers.

    Cloud computing demolished those assumptions. Today, your data lives across AWS, Azure, and Google Cloud simultaneously. Employees connect from home, cafes, and co-working spaces. Applications talk to third-party APIs. Contractors access internal tools from personal devices. The “perimeter” doesn’t exist anymore — and yet many organizations still operate as if it does.

    The consequences are severe. According to IBM’s 2025 Cost of a Data Breach Report, 45% of breaches now involve cloud environments, and the majority of those are enabled by over-privileged access credentials. Attackers don’t break in — they log in. That’s exactly the vulnerability the Zero Trust security model is designed to eliminate.

    What Zero Trust Actually Means in Practice

    The phrase “never trust, always verify” has become something of a marketing buzzword, but beneath the slogan is a genuinely powerful architectural philosophy. Zero Trust is not a single product you buy or a switch you flip. It’s a strategic framework built on three core principles.

    Verify Every Identity, Every Time

    No user, device, or service is automatically trusted — not even the CEO, not even an internal server-to-server call. Every access request must be authenticated, authorized, and continuously validated. This means multi-factor authentication (MFA) is table stakes, but it goes further: behavioral analytics, device health checks, and contextual signals like geographic location and login time all factor into access decisions.

    Apply Least Privilege Access

    Users and systems should only have access to the exact resources they need for their specific task — nothing more. This principle of least privilege limits the blast radius of any compromise. If a developer’s credentials are stolen, an attacker should gain access to one project folder, not your entire cloud infrastructure. Role-based access control (RBAC) and attribute-based access control (ABAC) are the practical tools that make this possible at scale.

    Assume Breach Has Already Occurred

    This is the mindset shift that separates Zero Trust from legacy security thinking. Instead of trying to keep attackers out, you design your systems as if a breach is always possible or already happening. That means encrypting data in transit and at rest, segmenting your network into micro-perimeters, logging every access event, and building automated detection and response capabilities. The goal is to contain damage and reduce dwell time — the window between intrusion and discovery.

    Building a Zero Trust Architecture in the Cloud: Step by Step

    Implementing the Zero Trust security model in a cloud environment requires a phased, structured approach. Trying to do everything at once leads to operational chaos. Here’s a practical roadmap that works for organizations of all sizes.

    Step 1 — Map Your Protect Surface

    Before you can protect anything, you need to know what you have. Conduct a thorough inventory of your cloud assets: data stores, applications, workloads, APIs, and user accounts. Identify your most sensitive data — customer PII, financial records, intellectual property — and map how it flows through your systems. This “protect surface” is much smaller than your entire attack surface, and focusing here first gives you maximum security impact with manageable effort.

    Step 2 — Implement Strong Identity and Access Management

    Identity is the new perimeter in a cloud-first world. Deploy a centralized Identity Provider (IdP) — tools like Okta, Microsoft Entra ID (formerly Azure AD), or Google Cloud Identity are leading choices in 2026. Enforce MFA across all accounts without exception, including service accounts. Implement Single Sign-On (SSO) to reduce password fatigue while maintaining auditability. Critically, audit your existing permissions and eliminate privilege creep — the gradual accumulation of excess access rights that builds up over time as roles change.

    Step 3 — Segment Your Network with Micro-Perimeters

    Traditional network segmentation divided infrastructure into broad zones. Micro-segmentation goes far deeper, isolating individual workloads, applications, and even specific data flows. In a cloud context, this means using Virtual Private Clouds (VPCs), security groups, and software-defined networking to ensure that even if an attacker compromises one workload, they cannot move laterally to adjacent systems. According to Gartner, organizations that implement micro-segmentation reduce the lateral movement of attackers by up to 72% compared to flat network architectures.

    Step 4 — Encrypt Everything and Manage Keys Properly

    End-to-end encryption is non-negotiable under Zero Trust. Encrypt data at rest using AES-256 or stronger. Encrypt all data in transit using TLS 1.3. But encryption is only as strong as your key management — and this is where many organizations stumble. Use dedicated Key Management Services (KMS) like AWS KMS, Azure Key Vault, or HashiCorp Vault. Rotate keys on a scheduled basis, restrict key access using the same least-privilege principles applied to data access, and never store encryption keys in the same location as the data they protect.

    Step 5 — Deploy Continuous Monitoring and Automated Response

    Zero Trust is not a set-and-forget configuration. Continuous validation requires continuous visibility. Implement a cloud-native Security Information and Event Management (SIEM) solution and feed it logs from every layer of your stack — identity events, network flows, API calls, and application behavior. Use User and Entity Behavior Analytics (UEBA) to detect anomalies that rules-based systems miss. In 2026, AI-powered threat detection tools have matured significantly: platforms like Microsoft Sentinel, Splunk, and Palo Alto Cortex XSIAM can automatically isolate compromised accounts or quarantine suspicious workloads within seconds of detecting anomalous behavior, dramatically reducing mean time to respond (MTTR).

    Step 6 — Extend Zero Trust to Third Parties and APIs

    Your security posture is only as strong as your weakest integration. Third-party vendors, contractors, and APIs represent some of the highest-risk access points in a modern cloud environment. Apply the same identity verification and least-privilege principles to external parties as you do to internal users. Implement API gateways with rate limiting, token-based authentication (OAuth 2.0 and OpenID Connect), and continuous monitoring of API traffic patterns. Conduct regular vendor security assessments and include Zero Trust compliance requirements in contracts where possible.

    Cloud-Specific Tools and Technologies That Enable Zero Trust

    The major cloud providers have invested heavily in native Zero Trust capabilities, and in 2026, the tooling ecosystem is more mature than ever. Understanding which tools align with which principles helps you avoid redundant spending and coverage gaps.

    Identity and Access

    • Microsoft Entra ID with Conditional Access: Evaluates real-time signals including device compliance, location, and risk score before granting access. Integrates natively across Microsoft 365 and Azure.
    • AWS IAM Identity Center: Centralized access management for AWS accounts and business applications, with fine-grained permission sets.
    • Google BeyondCorp Enterprise: Google’s own Zero Trust implementation, designed for context-aware access to applications without a traditional VPN.

    Network Security

    • Secure Access Service Edge (SASE): Combines network security functions with wide-area networking capabilities, delivered from the cloud. Vendors like Zscaler, Cloudflare One, and Netskope lead this space in 2026.
    • Cloud-native firewalls and WAFs: AWS Network Firewall, Azure Firewall Premium, and Google Cloud Armor provide deep packet inspection and threat intelligence integration at the network layer.

    Visibility and Detection

    • Cloud Security Posture Management (CSPM): Tools like Wiz, Orca Security, and Prisma Cloud continuously scan your cloud environment for misconfigurations — one of the leading causes of cloud breaches.
    • Cloud Detection and Response (CDR): Emerging category in 2026 that focuses specifically on detecting and responding to threats within cloud-native environments in real time.

    Common Implementation Mistakes and How to Avoid Them

    Organizations frequently stall or fail in their Zero Trust journey due to predictable pitfalls. Knowing them in advance saves significant time, money, and frustration.

    Treating Zero Trust as a Product Purchase

    No single vendor delivers Zero Trust out of the box, despite what marketing materials claim. Zero Trust is an architectural strategy that requires coordinated implementation across identity, network, data, and application layers. Evaluate vendors based on how well their tools integrate into your existing environment and support your specific Zero Trust goals — not on whether their product is labeled “Zero Trust ready.”

    Skipping the Discovery Phase

    Jumping straight to tool deployment without a clear map of your protect surface is one of the most common and costly mistakes. You cannot apply least-privilege access to data flows you don’t know exist. Invest adequate time in asset discovery and data classification before any technical implementation begins.

    Creating Excessive Friction for Legitimate Users

    Security that makes legitimate work impossible will be bypassed. A poorly configured Zero Trust implementation that requires constant re-authentication or blocks legitimate access will drive employees toward shadow IT and workarounds. Balance security with usability through intelligent, risk-based authentication policies. Require step-up authentication only when risk signals warrant it, not as a blanket policy for every action.

    Neglecting Service-to-Service Authentication

    Human users often get all the attention, but in modern cloud architectures, machine-to-machine communication vastly outnumbers human access events. Microservices, serverless functions, and automated pipelines all generate access requests that must be authenticated and authorized under Zero Trust principles. Implement service mesh technologies like Istio or AWS App Mesh to enforce mutual TLS (mTLS) authentication between services.

    The Zero Trust security model represents a fundamental rethinking of how trust is granted in digital systems — and in a cloud-first world, it’s the most effective framework available for protecting what matters most. According to Forrester Research, organizations with mature Zero Trust implementations experience 50% lower breach costs compared to those still operating on perimeter-based models. The implementation journey takes time and deliberate planning, but each phase delivers measurable security improvements. Start with identity, layer in network segmentation, encrypt everything, and build visibility from day one. The organizations that treat Zero Trust as a continuous practice rather than a one-time project are the ones that stay ahead of evolving threats in 2026 and beyond.

    This article is for informational purposes only. Always verify technical information and consult relevant cybersecurity professionals for advice specific to your organization’s environment and requirements.

    Frequently Asked Questions

    What is the Zero Trust security model in simple terms?

    Zero Trust is a security framework based on the principle of “never trust, always verify.” Unlike traditional models that automatically trust users inside a network, Zero Trust requires every user, device, and application to continuously prove their identity and legitimacy before accessing any resource — regardless of whether they’re inside or outside the corporate network.

    Is Zero Trust only for large enterprises, or can small businesses use it too?

    Zero Trust principles apply to organizations of all sizes. Small and medium businesses can start with high-impact, cost-effective measures like enabling MFA on all accounts, using a centralized identity provider, and reviewing user permissions regularly. Many cloud providers now include Zero Trust-aligned tools in their standard offerings, making entry-level implementation accessible without enterprise budgets.

    How long does it take to implement Zero Trust in a cloud environment?

    A full Zero Trust implementation is typically a multi-year journey, not a single project. However, you can achieve significant security improvements within the first 90 days by focusing on identity and access management — the highest-impact starting point. Organizations that take a phased approach, prioritizing their most sensitive data and highest-risk access points first, see measurable risk reduction at each stage.

    Does Zero Trust replace a VPN?

    In many cases, yes — Zero Trust Network Access (ZTNA) is increasingly replacing traditional VPNs. VPNs grant broad network access once a user connects, which conflicts with least-privilege principles. ZTNA tools grant access only to specific applications based on verified identity and device posture, providing much tighter control. In 2026, ZTNA adoption has accelerated significantly as organizations modernize their remote access infrastructure.

    What’s the difference between Zero Trust and SASE?

    Zero Trust is a security philosophy and architectural framework. SASE (Secure Access Service Edge) is a cloud-delivered architecture that bundles networking and security functions together. SASE often incorporates Zero Trust principles — particularly through its ZTNA component — but they are not the same thing. Think of Zero Trust as the strategy and SASE as one possible delivery model for implementing parts of that strategy in a cloud environment.

    How do you handle Zero Trust for DevOps and CI/CD pipelines?

    DevOps environments present unique challenges because automated pipelines generate enormous volumes of access requests. Best practices include using short-lived credentials and tokens rather than long-lived secrets, storing secrets in dedicated vaults like HashiCorp Vault or AWS Secrets Manager, implementing policy-as-code to enforce access rules consistently across pipeline stages, and scanning pipeline configurations regularly for hardcoded credentials or excessive permissions. Integrating security checks directly into the CI/CD pipeline — a practice known as DevSecOps — aligns naturally with Zero Trust principles.

    How do you measure whether your Zero Trust implementation is working?

    Key metrics include mean time to detect (MTTD) and mean time to respond (MTTR) to security incidents, the number of over-privileged accounts identified and remediated, percentage of workloads protected by micro-segmentation, MFA adoption rate across all user types, and the frequency and severity of lateral movement detected in your environment. Regular penetration testing and red team exercises also provide ground-truth validation of your Zero Trust controls in realistic attack scenarios.

  • Best DevOps Tools in 2025: Jenkins, GitHub Actions and More

    Best DevOps Tools in 2025: Jenkins, GitHub Actions and More

    Why DevOps Tooling Has Never Mattered More

    Modern software teams live or die by their pipelines — and choosing the best DevOps tools in 2025 and beyond can mean the difference between shipping features in hours versus weeks. According to the 2025 DORA State of DevOps Report, elite-performing teams deploy code 973 times more frequently than low performers, and that gap is almost entirely driven by toolchain maturity. Whether you’re a solo developer setting up your first CI/CD pipeline or an engineering lead evaluating enterprise-grade automation, understanding the DevOps landscape in 2026 is non-negotiable.

    DevOps itself has evolved dramatically. What started as a cultural movement bridging development and operations has grown into a sophisticated ecosystem of tools covering continuous integration, continuous delivery, container orchestration, infrastructure as code, monitoring, and security. In 2026, the market for DevOps tools is estimated to exceed $25 billion globally, up from roughly $10 billion in 2021 — a compound annual growth rate that reflects just how seriously organizations are investing in automation and operational efficiency.

    This guide cuts through the noise. We’ll cover the most important categories, highlight the standout platforms, and give you practical guidance on how to build a toolchain that actually works for your team.

    The Core Categories Every DevOps Toolchain Needs

    Before diving into specific tools, it helps to understand the functional layers that make up a modern DevOps toolchain. Each category solves a distinct problem, and the best teams pick best-in-class tools for each layer rather than relying on a single vendor to do everything adequately.

    Continuous Integration and Continuous Delivery (CI/CD)

    CI/CD is the backbone of any DevOps practice. Continuous integration means automatically building and testing code every time a developer pushes a change. Continuous delivery extends that by automating the deployment pipeline all the way to production — or at least to a staging environment ready for release. Tools in this category include Jenkins, GitHub Actions, GitLab CI/CD, CircleCI, and Harness.

    Infrastructure as Code (IaC)

    Managing servers and cloud resources by hand is error-prone and doesn’t scale. Infrastructure as code tools like Terraform, Pulumi, and AWS CloudFormation let teams define their infrastructure in version-controlled configuration files, enabling repeatable, auditable deployments. In 2026, Terraform remains the dominant IaC tool in enterprise environments, though Pulumi is gaining ground rapidly among teams that prefer writing infrastructure logic in general-purpose languages like Python or TypeScript.

    Containerization and Orchestration

    Docker standardized how applications are packaged, and Kubernetes became the de facto standard for running those containers at scale. Container orchestration ensures that your application automatically scales up under load, recovers from failures, and deploys new versions with zero downtime. This layer is now essentially table stakes for any team running microservices.

    Monitoring, Observability, and Security

    Shipping code fast means nothing if you can’t detect problems quickly. Monitoring tools like Prometheus, Grafana, and Datadog give teams real-time visibility into application health. On the security side, DevSecOps practices integrate tools like Snyk, Trivy, and Checkov directly into pipelines to catch vulnerabilities before they reach production — a category that has seen massive adoption growth in 2025 and 2026.

    Jenkins vs. GitHub Actions: The CI/CD Showdown

    If you ask most developers to name the best DevOps tools they’ve used, Jenkins and GitHub Actions will appear in almost every conversation. They represent two distinct philosophies — and understanding the difference will save you months of frustration.

    Jenkins: The Veteran Workhorse

    Jenkins has been around since 2011, and in 2026 it still powers CI/CD pipelines at thousands of large enterprises. Its core strength is flexibility. With over 1,800 plugins available, Jenkins can integrate with virtually any tool, cloud provider, or legacy system in existence. If your organization has unusual requirements — on-premises deployments, custom security controls, multi-cloud pipelines with exotic tooling — Jenkins can almost certainly accommodate them.

    The tradeoff is complexity. Jenkins requires you to manage your own infrastructure (or use a managed service like CloudBees), maintain your plugin ecosystem, and write pipelines in Groovy-based Jenkinsfile syntax that has a steep learning curve. Teams that invest in Jenkins often find themselves maintaining the CI/CD system itself as a significant ongoing operational burden.

    Best for: Large enterprises with complex, heterogeneous environments; teams with dedicated DevOps engineers; organizations with strict on-premises or air-gapped requirements.

    GitHub Actions: The Modern Default

    GitHub Actions launched in 2019 and has since become the default CI/CD choice for new projects. Its tight integration with GitHub repositories, YAML-based workflow syntax, and massive marketplace of pre-built actions make it genuinely easy to get started. A basic pipeline that builds, tests, and deploys a Node.js application can be set up in under 30 minutes by someone who has never used CI/CD before.

    GitHub Actions uses a runner-based model where workflows execute on GitHub-hosted machines (or your own self-hosted runners). The pricing model is consumption-based — free tier for public repositories, and generous free minutes for private repositories on most paid plans. In 2026, GitHub Actions has over 25,000 actions available in its marketplace, covering everything from cloud deployments to Slack notifications to AI-powered code review.

    Best for: Teams already using GitHub; startups and mid-size companies; projects where speed of setup matters; open-source development.

    Other Strong CI/CD Contenders

    GitLab CI/CD deserves special mention for teams using GitLab as their source control platform. It offers a deeply integrated experience where your repository, CI/CD, container registry, and security scanning all live in one place — reducing the integration overhead that comes with mixing tools from different vendors. CircleCI remains popular for teams that want more configurability than GitHub Actions without the operational overhead of Jenkins. And Harness has emerged as a powerful enterprise option focused specifically on continuous delivery with AI-driven pipeline optimization.

    Infrastructure, Containers, and the Cloud-Native Stack

    The best DevOps tools don’t operate in isolation — they form an interconnected stack. Once you’ve chosen your CI/CD platform, you need to think carefully about how code actually gets deployed to infrastructure.

    Terraform and the IaC Landscape in 2026

    HashiCorp’s 2023 license change for Terraform sparked significant community concern and accelerated the development of OpenTofu, an open-source Terraform fork maintained by the Linux Foundation. In 2026, OpenTofu has gained substantial enterprise adoption, particularly among organizations uncomfortable with HashiCorp’s (now IBM-owned) commercial terms. Both tools use the same HCL syntax and are broadly compatible, giving teams optionality without starting from scratch.

    For teams deeply invested in AWS, AWS CDK (Cloud Development Kit) has matured significantly and allows infrastructure to be defined in familiar programming languages. Google Cloud’s Deployment Manager and Azure Bicep serve similar roles in their respective ecosystems. The practical advice: use Terraform or OpenTofu if you’re multi-cloud or want the broadest community support; use native IaC tools if you’re locked into a single cloud and want tighter integration.

    Kubernetes and Its Ecosystem

    Kubernetes (often called K8s) remains the dominant container orchestration platform, but its complexity has spawned a rich ecosystem of tools designed to make it more manageable. Helm is the standard package manager for Kubernetes applications, allowing teams to template and version their deployments. ArgoCD and Flux implement GitOps patterns, where the desired state of your cluster is defined in Git and automatically synchronized by the platform — a practice that dramatically improves auditability and disaster recovery.

    For teams that find raw Kubernetes too complex, managed services like Amazon EKS, Google GKE, and Azure AKS abstract away the control plane management. In 2026, the majority of new Kubernetes deployments are on managed services rather than self-hosted clusters, reflecting a broader industry trend toward reducing undifferentiated operational burden.

    Docker and Container Security

    Docker remains the standard containerization tool, though Podman has gained traction in enterprise Linux environments due to its daemonless, rootless architecture that offers better security characteristics. For container image scanning, Trivy has emerged as the go-to open-source tool, while Snyk and Aqua Security dominate the commercial space. Integrating image scanning directly into your CI/CD pipeline — blocking builds that contain critical vulnerabilities — is now considered standard practice rather than optional.

    Monitoring, Observability, and AIOps in 2026

    Deploying fast is only valuable if you can detect and respond to problems quickly. The observability space has consolidated significantly, with a few platforms emerging as clear leaders.

    The Open-Source Stack: Prometheus and Grafana

    For teams that want powerful observability without vendor lock-in, the Prometheus and Grafana combination is the gold standard. Prometheus handles metrics collection and alerting; Grafana provides visualization dashboards. Both are open-source, have enormous communities, and integrate with virtually every infrastructure component. The Grafana ecosystem has expanded to include Loki (log aggregation) and Tempo (distributed tracing), creating a full observability stack under one umbrella.

    Commercial Observability Platforms

    Datadog remains the leading commercial observability platform in 2026, offering unified metrics, logs, traces, and real-user monitoring in a single product. Its AI-powered anomaly detection and automatic service mapping make it particularly valuable for complex microservices architectures. New Relic and Dynatrace compete closely, with Dynatrace particularly strong in enterprise environments where automated root-cause analysis and AI-driven insights justify the premium pricing.

    A significant 2026 trend is the rise of OpenTelemetry as a vendor-neutral standard for instrumentation. By instrumenting your application with OpenTelemetry, you can send telemetry data to any compatible backend — giving you the flexibility to switch commercial vendors without re-instrumenting your codebase. Most major observability vendors now support OpenTelemetry natively, making it the recommended approach for new projects.

    AI-Augmented DevOps

    Perhaps the most significant shift in the DevOps tooling landscape between 2024 and 2026 has been the integration of AI into core workflows. GitHub Copilot now extends beyond code completion into pull request summarization and automated code review. Tools like Harness use AI to predict deployment risk and recommend rollback thresholds. PagerDuty’s AIOps features automatically correlate alerts and suppress noise during incidents, reducing alert fatigue — one of the most persistent problems in on-call engineering. According to a 2025 survey by Stack Overflow, 76% of professional developers reported using AI-assisted coding tools in their workflow, up from 44% in 2023.

    Building Your DevOps Toolchain: Practical Guidance

    Knowing which tools exist is only half the battle. The other half is making smart choices about what to adopt and in what order.

    Start With the Fundamentals

    If you’re building a toolchain from scratch, prioritize in this order: source control (GitHub or GitLab), CI/CD (GitHub Actions is the easiest starting point), containerization (Docker), and basic monitoring. Get these four working well before adding infrastructure-as-code tooling or advanced observability. Premature complexity is one of the most common failure modes for DevOps transformations.

    Avoid Tool Sprawl

    The DevOps tools market in 2026 is enormous, and it’s tempting to adopt every impressive tool you encounter. Resist this impulse. Each tool you add to your stack is a tool your team needs to learn, maintain, and debug at 2 AM during an incident. A lean, well-understood toolchain consistently outperforms a bloated one full of tools nobody fully understands.

    Invest in Documentation and Runbooks

    The best DevOps teams treat their pipelines and infrastructure as products — with documentation, onboarding guides, and runbooks. When your deployment pipeline breaks on a Friday afternoon, a well-written runbook transforms a crisis into a routine repair. This cultural investment pays dividends that no tool purchase can replicate.

    Evaluate Security Early

    DevSecOps — integrating security into every stage of the development pipeline — is no longer optional for most organizations. Evaluate tools like Snyk, Checkov, or Semgrep early in your toolchain design. The cost of fixing a security vulnerability in production is dramatically higher than catching it during a pull request review. Many of these tools offer free tiers that are genuinely useful for smaller teams.

    Frequently Asked Questions

    What are the most important DevOps tools for beginners in 2026?

    For beginners, the most important starting point is a solid CI/CD platform — GitHub Actions is the most approachable option in 2026 due to its tight GitHub integration, YAML-based configuration, and extensive marketplace. Pair it with Docker for containerization and Prometheus plus Grafana for basic monitoring. These three components give you a functional, industry-standard DevOps foundation without overwhelming complexity. Once comfortable, expand into infrastructure-as-code with Terraform or OpenTofu, and container orchestration with Kubernetes via a managed service like AWS EKS or Google GKE.

    Is Jenkins still worth learning in 2026?

    Yes, but with important context. Jenkins remains widely deployed in large enterprises, and understanding it is valuable if you’re working in — or interviewing for roles at — organizations that have significant existing Jenkins infrastructure. However, for new projects or greenfield environments, GitHub Actions or GitLab CI/CD are generally better choices due to lower operational overhead and faster time-to-value. Learning Jenkins specifically to build new pipelines from scratch is increasingly hard to justify unless you have specific requirements that only Jenkins can meet.

    What is the difference between DevOps and DevSecOps?

    DevOps is the practice of integrating software development and IT operations to enable faster, more reliable software delivery. DevSecOps extends this by embedding security practices directly into the DevOps pipeline — shifting security left so that vulnerabilities are caught during development rather than after deployment. In practice, DevSecOps means adding security scanning tools like Snyk or Trivy to your CI/CD pipeline, implementing infrastructure security scanning with tools like Checkov, and making security a shared responsibility across development, operations, and security teams rather than a gate at the end of the process.

    How does Kubernetes fit into a DevOps toolchain?

    Kubernetes serves as the runtime environment where your containerized applications actually run. In a typical DevOps toolchain, your CI/CD pipeline (Jenkins, GitHub Actions, etc.) builds and tests your code, packages it as a Docker container, pushes the container image to a registry, and then deploys it to a Kubernetes cluster. Kubernetes handles the operational complexity of running containers at scale — scheduling workloads across servers, scaling up under load, restarting failed containers, and managing zero-downtime deployments. Tools like Helm, ArgoCD, and Flux make managing Kubernetes deployments more maintainable and auditable over time.

    What is GitOps and why is it becoming the standard deployment approach?

    GitOps is a deployment methodology where the desired state of your infrastructure and applications is defined entirely in Git repositories, and automated tooling continuously reconciles the actual running state to match that desired state. Tools like ArgoCD and Flux implement GitOps for Kubernetes environments. The appeal is significant: every change is version-controlled and auditable, rollbacks are as simple as reverting a Git commit, and there’s a single source of truth for what should be running in your environment. In 2026, GitOps has moved from emerging practice to mainstream recommendation for teams running Kubernetes at any meaningful scale.

    How should small teams approach DevOps tooling without dedicated DevOps engineers?

    Small teams should prioritize managed services and tools that minimize operational overhead. GitHub Actions eliminates the need to manage CI/CD infrastructure. Managed Kubernetes services (EKS, GKE, AKS) remove the complexity of running your own control plane. Cloud-native monitoring services or the free tier of tools like Datadog can get you solid observability without a dedicated engineer. The key principle is avoiding tools that require full-time maintenance just to keep running. For most small teams, a simple GitHub Actions pipeline deploying to a managed container service like AWS ECS or Google Cloud Run will outperform a complex Kubernetes setup that nobody has time to manage properly.

    What role is AI playing in DevOps tooling in 2026?

    AI has become genuinely integrated into DevOps workflows rather than remaining a marketing buzzword. GitHub Copilot assists with writing pipeline configuration and infrastructure code. AI-powered features in tools like Harness predict deployment risk based on historical data. Observability platforms including Datadog and Dynatrace use machine learning to automatically detect anomalies, correlate incidents, and surface likely root causes — dramatically reducing mean time to resolution. AIOps platforms are helping on-call engineers manage alert fatigue by intelligently grouping related alerts during incidents. The most practical advice: adopt AI features in tools you already use rather than adding dedicated AI tools — the integration benefits outweigh the novelty of standalone AI DevOps products.

    The DevOps tooling landscape in 2026 is mature, competitive, and genuinely impressive in what it enables teams to accomplish. From the best DevOps tools like GitHub Actions and Jenkins powering CI/CD pipelines, to Terraform managing cloud infrastructure, to Kubernetes orchestrating containerized applications at scale, the modern DevOps stack gives even small teams capabilities that would have required entire operations departments a decade ago. The key is building deliberately — starting with fundamentals, avoiding unnecessary complexity, integrating security early, and treating your toolchain as a living system that evolves with your team’s needs. The teams that win aren’t necessarily those with the most sophisticated tools; they’re the ones who deeply understand and effectively operate the tools they’ve chosen.

    Disclaimer: This article is for informational purposes only. Always verify technical information and consult relevant professionals for specific advice regarding your organization’s DevOps strategy, security requirements, and technology decisions.

  • How AI Is Transforming DevOps: AIOps Explained

    How AI Is Transforming DevOps: AIOps Explained

    The Quiet Revolution Happening Inside Your Software Pipeline

    AI is reshaping how software teams build, deploy, and maintain systems — and AIOps is the engine driving that transformation in 2026. If you work in software development, IT operations, or DevOps, understanding how artificial intelligence is being woven into operational workflows is no longer optional. It is quickly becoming a core professional literacy. This article breaks down what AIOps actually is, why it matters, and how real teams are using it to ship faster, fail less, and recover smarter.

    The traditional DevOps model — continuous integration, continuous delivery, collaborative culture — was already a massive leap forward from siloed software development. But as systems grow more complex, distributed, and data-heavy, human operators simply cannot monitor everything at once. AIOps fills that gap. It uses machine learning, big data analytics, and automation to augment the capabilities of DevOps teams, helping them detect anomalies, predict failures, and respond to incidents in ways that were impossible just a few years ago.

    What AIOps Actually Means — Beyond the Buzzword

    AIOps stands for Artificial Intelligence for IT Operations. The term was coined by Gartner in 2017, but in 2026, it has matured well beyond its original definition. Today, AIOps refers to platforms and practices that combine AI and machine learning with IT operational data — including logs, metrics, events, and traces — to automate and improve decision-making across the entire software delivery lifecycle.

    It is important to understand that AIOps is not a single tool you install. It is a capability layer that sits across your DevOps pipeline, ingesting data from monitoring systems, CI/CD pipelines, cloud infrastructure, security tools, and service desks. It then applies intelligent analysis to surface insights, reduce alert noise, and in many cases, take automated corrective action without human intervention.

    The Core Components of an AIOps Platform

    • Data Ingestion: Collecting structured and unstructured operational data from across the stack — logs, metrics, events, traces, and topology data.
    • Machine Learning Models: Algorithms that detect patterns, anomalies, correlations, and predictive signals within operational data.
    • Automation Engine: Workflow automation that executes responses, routes alerts, or triggers remediation scripts based on AI-driven insights.
    • Observability Integration: Deep hooks into monitoring and observability platforms like Datadog, Dynatrace, New Relic, and Prometheus.
    • Natural Language Interfaces: Increasingly, AIOps platforms include conversational AI interfaces so engineers can query system health in plain English.

    AIOps vs. Traditional Monitoring

    Traditional monitoring is reactive and threshold-based. You set a rule — if CPU usage exceeds 90%, send an alert — and the system fires off a notification. The problem is that modern distributed systems generate millions of events per day. A Gartner report found that IT operations teams receive so many alerts that up to 27% of them are ignored entirely, creating dangerous blind spots. AIOps changes the model from threshold-based alerting to pattern-based intelligence. Instead of firing on every spike, it understands what normal looks like and flags only meaningful deviations.

    How AI Is Transforming Each Stage of the DevOps Lifecycle

    One of the most powerful aspects of AIOps is that it does not just improve one part of DevOps — it has practical applications across every stage of the software delivery pipeline. Let us walk through each phase and see where AI is making a real difference.

    Planning and Code Development

    AI-assisted coding tools like GitHub Copilot, Amazon CodeWhisperer, and newer large language model-powered IDEs are now deeply embedded in how developers write code. But beyond code generation, AI is also being used at the planning stage to analyze historical sprint data, predict delivery timelines, and flag technical debt before it becomes a bottleneck. Teams using AI-augmented planning tools in 2026 report significantly more accurate sprint forecasting compared to purely manual estimation methods.

    Continuous Integration and Testing

    AI is transforming testing by making it smarter rather than just faster. Intelligent test selection algorithms analyze code changes and identify which tests are most likely to catch defects — reducing full test suite run times dramatically. AI-powered test generation tools can now create meaningful unit and integration tests from code context alone. According to a 2025 DevOps Research and Assessment (DORA) report, organizations using AI-assisted testing saw a 34% reduction in production defects compared to those relying on manual test authoring.

    Deployment and Release Management

    Progressive delivery — canary releases, feature flags, blue-green deployments — becomes far more powerful when AI is monitoring real-time impact. AIOps platforms can analyze user behavior, error rates, and performance metrics during a canary rollout and automatically halt a deployment if it detects degradation signals before a human engineer would even notice. This kind of intelligent deployment gating is becoming standard practice at high-performing engineering organizations.

    Monitoring, Observability, and Incident Response

    This is where AIOps has made the most dramatic impact. Traditional observability generated mountains of data but left engineers to sift through it manually. AI-driven observability correlates signals across logs, metrics, and traces automatically, surfacing probable root causes rather than a noisy list of symptoms. Tools like Dynatrace’s Davis AI engine and Datadog’s Watchdog are able to correlate events across thousands of microservices and identify causal chains in seconds. The result is mean time to resolution (MTTR) dropping from hours to minutes in organizations that have fully embraced AI-driven incident response.

    Post-Incident Learning and Capacity Planning

    AIOps does not just help you respond faster — it helps you learn better. AI-driven post-incident analysis can automatically generate blameless post-mortem drafts, identify recurring failure patterns, and flag systemic risks that human reviewers might miss. On the capacity planning side, machine learning models trained on historical usage patterns can predict infrastructure demand weeks in advance, enabling proactive scaling that prevents performance degradation before customers ever experience it.

    Real-World AIOps in Action: What Leading Teams Are Doing

    Understanding AIOps conceptually is useful. Seeing how real organizations apply it is where the picture becomes concrete and actionable.

    Reducing Alert Fatigue at Scale

    One of the most universally painful problems in DevOps is alert fatigue — the state where engineers have been burned by so many false positives that they start ignoring alerts altogether. AIOps platforms tackle this through alert correlation and noise reduction. Instead of forwarding 500 individual alerts to an on-call engineer at 2am, an AIOps system groups related signals into a single incident with contextual enrichment. PagerDuty’s AI-driven noise reduction capabilities, for example, have been shown to reduce alert volume by over 70% for enterprise customers, without missing genuine incidents.

    Predictive Failure Detection in Cloud Infrastructure

    Large-scale cloud environments running across multiple availability zones generate behavioral signatures before they fail. Disk performance subtly degrades. Memory allocation patterns shift. Network latency edges upward. AI models trained on these signals can identify failure precursors hours or even days before an outage occurs. In 2025, Netflix’s engineering team published research showing that their ML-based predictive failure detection systems prevented an estimated 140 hours of potential downtime across their streaming infrastructure over a 12-month period.

    AI-Powered Runbooks and Auto-Remediation

    The most advanced AIOps implementations go beyond detection to automated remediation. When an AI system identifies a known failure pattern — say, a memory leak causing a specific microservice to degrade — it can automatically execute a remediation runbook: restarting the affected pods, scaling out additional instances, routing traffic away from the degraded node, and notifying the team with a full incident timeline. This kind of auto-remediation is not speculative; it is already deployed in production environments at major financial institutions, e-commerce platforms, and SaaS providers.

    Choosing and Implementing AIOps: A Practical Guide

    If you are evaluating AIOps for your organization — or trying to make a case for investment — here is a grounded, practical framework for thinking about adoption.

    Start With Your Biggest Pain Point

    AIOps adoption works best when it is solving a clearly defined problem rather than chasing a trend. Ask your team: Where do we lose the most time? Is it alert noise overwhelming on-call engineers? Is it slow root cause analysis during incidents? Is it unpredictable infrastructure costs? Identifying one high-pain area lets you measure success clearly and build internal confidence before expanding scope.

    Evaluate the Major Platforms

    • Dynatrace: Best-in-class for AI-driven observability and root cause analysis. Strong enterprise focus with deep Kubernetes integration.
    • Datadog: Highly popular in mid-market and enterprise. Excellent breadth of integrations, strong ML-powered anomaly detection via Watchdog.
    • PagerDuty: Industry leader for AI-driven incident management, alert correlation, and on-call workflow automation.
    • Splunk IT Service Intelligence: Powerful for log-heavy environments and complex event correlation at scale.
    • IBM Watson AIOps: Enterprise-grade platform with strong natural language interface capabilities and integration with legacy infrastructure.
    • Moogsoft: Purpose-built AIOps platform with strong focus on noise reduction and event clustering.

    Build Data Quality Before AI Capability

    AIOps is only as good as the data it consumes. One of the most common reasons AIOps implementations underperform is poor underlying data quality — inconsistent log formats, missing metadata, incomplete instrumentation. Before layering AI on top of your operations, invest in solid observability foundations: structured logging, distributed tracing, consistent metric naming, and service topology mapping. The AI will have far more to work with and will produce far more reliable results.

    Maintain Human Oversight

    Even the most advanced AIOps platform is a tool, not a replacement for skilled engineers. The best implementations use AI to amplify human judgment — surfacing insights faster, reducing cognitive load, and handling routine remediation — while keeping humans in the loop for complex decisions, architecture changes, and novel failure modes. Build clear escalation paths where automated systems know when to hand off to a human engineer rather than continuing to act autonomously.

    The Challenges and Limitations of AIOps You Should Know

    No technology is without its limitations, and AIOps is no exception. Understanding these challenges helps you adopt the technology with realistic expectations and avoid common pitfalls.

    Model drift and retraining: Machine learning models trained on historical operational data can become stale as systems evolve. An AI that learned what normal looks like six months ago may misclassify behavior after a major architectural change. AIOps platforms need regular model retraining and human feedback loops to stay accurate.

    Explainability gaps: When an AI system flags an anomaly or recommends a remediation action, engineers often want to know why. Many ML models — particularly deep learning-based approaches — are not easily interpretable. This black-box problem can erode trust and make it harder to validate AI recommendations. Look for platforms that provide explainable AI outputs alongside recommendations.

    Vendor lock-in risk: Many commercial AIOps platforms use proprietary data models and integrations. Deep integration with a single vendor’s ecosystem can create significant switching costs down the line. Evaluate open standards support — OpenTelemetry compatibility, for instance — when assessing long-term platform viability.

    Cultural resistance: Introducing AI into incident response and deployment workflows can feel threatening to experienced engineers who have built deep intuition about their systems. Change management is as important as technical implementation. Frame AIOps as a tool that makes engineers more effective, not one that makes them redundant.

    According to a 2025 IDC survey, 41% of organizations cited organizational culture and skills gaps — not technology limitations — as the primary barrier to successful AIOps adoption. The human side of implementation deserves as much attention as the technical side.

    Frequently Asked Questions About AIOps

    What is the difference between AIOps and MLOps?

    AIOps and MLOps are related but distinct. AIOps applies artificial intelligence to IT operations and DevOps workflows — monitoring, alerting, incident management, and deployment automation. MLOps, on the other hand, refers to the operational practices for building, deploying, and maintaining machine learning models themselves. In other words, AIOps is a consumer of AI capabilities, while MLOps is the discipline that manages the production of those AI capabilities. A mature engineering organization will likely use both.

    Do you need a large organization to benefit from AIOps?

    Not necessarily. While enterprise organizations with complex, high-volume environments see the most dramatic ROI from AIOps, smaller teams can benefit meaningfully from AI-assisted alerting and incident management. Platforms like Datadog and PagerDuty offer tiered pricing and can deliver real value even for teams of 10 to 20 engineers. The key is matching the platform’s complexity to your actual operational volume — a small startup running three microservices likely does not need the full enterprise AIOps stack.

    How long does it take to implement AIOps effectively?

    Realistic implementation timelines vary significantly based on your existing observability maturity. Organizations with solid instrumentation and structured logging already in place can begin seeing value from AIOps tooling within four to eight weeks. Organizations starting from a lower baseline — fragmented monitoring, inconsistent logging — should plan for a three to six month foundational improvement phase before AIOps delivers reliable results. Full organizational adoption, including workflow changes and team training, typically takes six to twelve months for a mid-sized engineering team.

    Is AIOps secure? What are the data privacy implications?

    AIOps platforms ingest large volumes of operational data, which can include sensitive information — user behavior patterns, API call contents, error messages containing personal data. This raises legitimate data privacy and security concerns, particularly for organizations subject to GDPR, HIPAA, or SOC 2 compliance requirements. When evaluating AIOps platforms, scrutinize data retention policies, encryption standards, regional data residency options, and access controls carefully. Many enterprise platforms offer on-premises or private cloud deployment options for highly regulated environments.

    Can AIOps replace human DevOps engineers?

    No — and this is worth stating clearly. AIOps augments skilled engineers rather than replacing them. It handles the routine, high-volume, pattern-matching work that would otherwise consume enormous amounts of human attention. But complex system design, architectural decisions, novel failure investigation, and cultural leadership in engineering teams remain deeply human responsibilities. The 2025 DORA State of DevOps report found that organizations using AI tools saw engineer productivity increase by an average of 28%, with engineers spending significantly more time on high-value creative and architectural work rather than routine operational firefighting.

    What skills do DevOps engineers need to work effectively with AIOps?

    DevOps engineers working in AIOps environments benefit from a broader skill set that includes a foundational understanding of machine learning concepts — not necessarily model building, but enough to evaluate AI outputs critically and understand their limitations. Strong observability skills remain essential: understanding distributed tracing, structured logging, and metrics instrumentation gives you the ability to feed AIOps systems the quality data they need. Data literacy — the ability to interpret dashboards, understand statistical significance, and question AI recommendations — is increasingly valuable. Finally, Python scripting skills help when customizing automation workflows and integrating AIOps platforms with bespoke internal tooling.

    What does the future of AIOps look like beyond 2026?

    The trajectory of AIOps points toward increasingly autonomous, self-healing infrastructure. We are already seeing early-stage agentic AI systems that can not only detect and remediate known failures but reason through novel failure modes using large language model-powered analysis. The next frontier is AI systems that actively participate in architectural decision-making — flagging design choices during code review that are statistically likely to cause operational problems at scale. As AI reasoning capabilities improve, the boundary between development-time intelligence and runtime intelligence will blur, creating a continuous feedback loop where operational experience directly informs how software is designed and written.

    Building Toward Smarter, More Resilient Software Operations

    AIOps represents one of the most significant shifts in how engineering teams operate since the original DevOps movement itself. The combination of machine learning-powered anomaly detection, intelligent alert correlation, automated remediation, and AI-assisted observability is not just making IT operations faster — it is fundamentally changing what it means to run reliable software at scale. Organizations that invest thoughtfully in AIOps capabilities today — starting with strong data foundations, focusing on real pain points, and keeping skilled engineers firmly in the loop — will be positioned to deliver faster, more reliable software with smaller operational overhead than those that wait. The tools are mature, the use cases are proven, and the competitive advantage for early adopters is real and measurable. The question is no longer whether AI belongs in your DevOps practice. It is how quickly you can integrate it effectively.

    Disclaimer: This article is for informational purposes only. Always verify technical information and consult relevant professionals for specific advice regarding your organization’s technology infrastructure, security requirements, and operational practices.

  • Observability vs Monitoring: Understanding the Difference

    Observability vs Monitoring: Understanding the Difference

    Why Modern Engineering Teams Can’t Afford to Confuse These Two Concepts

    In 2026, as distributed systems grow more complex and downtime costs enterprises an average of $9,000 per minute according to Gartner research, understanding the difference between observability vs monitoring has never been more critical for engineering and DevOps teams.

    At first glance, monitoring and observability sound like the same thing. Both involve watching your systems. Both help you spot problems. Both are essential to keeping software running smoothly. But treating them as interchangeable is one of the most common — and costly — mistakes that engineering teams make. One tells you when something is wrong. The other helps you understand why.

    This guide breaks down the core differences, explains how each concept works in practice, and helps you build a strategy that uses both intelligently. Whether you’re running microservices on Kubernetes, managing cloud-native infrastructure, or scaling a SaaS product, this distinction matters more than you might think.

    The Foundations: What Monitoring Actually Does

    Monitoring is the practice of collecting predefined metrics from your systems and alerting you when those metrics cross specific thresholds. It’s inherently reactive and structured around known failure modes. You define what to watch, set your thresholds, and wait for alerts to fire.

    The Core Components of Traditional Monitoring

    A standard monitoring setup typically tracks several key signal types:

    • Infrastructure metrics: CPU usage, memory consumption, disk I/O, and network throughput
    • Application metrics: Request rates, error rates, response times, and queue depths
    • Uptime checks: Simple ping or HTTP checks confirming services are reachable
    • Log aggregation: Centralized collection of application and system logs
    • Alerting rules: Notifications triggered when metrics exceed defined thresholds

    Tools like Prometheus, Datadog, Nagios, and Zabbix are classic monitoring platforms. They excel at telling you: “Your CPU is at 95%,” or “Your error rate just spiked past 5%.” That information is invaluable — but it only scratches the surface of what you need during a complex incident.

    The Inherent Limitation of Monitoring Alone

    The fundamental constraint of monitoring is that it can only find problems you anticipated. If you didn’t write an alert for it, you won’t know about it. In legacy monolithic applications, this worked reasonably well. Systems were predictable, failure modes were well-understood, and dashboards could cover most scenarios.

    But modern distributed systems with dozens or hundreds of microservices, event-driven architectures, and complex dependency chains introduce failure modes that simply cannot all be predicted in advance. A 2025 CNCF survey found that 73% of engineering teams operating microservices reported experiencing production incidents where their existing monitoring dashboards provided no clear indication of the root cause. That gap is exactly where observability steps in.

    Observability: Understanding Systems You Didn’t Predict Would Break

    Observability is a property of a system — not a tool or a dashboard. A system is considered observable if you can determine its internal state by examining its external outputs. The term originates from control theory, introduced by Hungarian-American engineer Rudolf Kálmán in the 1960s, and was adapted for software engineering by pioneers at companies like Twitter and Google as they scaled to unprecedented complexity.

    Where monitoring asks “is this system healthy?” observability asks “what is this system actually doing, and why?” It enables engineers to ask arbitrary questions about system behavior — questions they didn’t think to ask before the incident started.

    The Three Pillars: Logs, Metrics, and Traces

    Observability is commonly built on three foundational data types, often called the three pillars:

    • Logs: Timestamped records of discrete events within your application. Logs are rich with context but can be expensive to store and query at scale. Structured logging, where events are recorded in JSON or similar formats, dramatically improves their usefulness.
    • Metrics: Numeric measurements sampled over time. Metrics are efficient to store and great for dashboards and alerting, but they’re aggregated, meaning they can hide the details of individual requests.
    • Traces: The distributed tracing component is what truly sets observability apart. A trace follows a single request as it travels through multiple services, capturing timing, errors, and context at each hop. Tools like Jaeger, Zipkin, and OpenTelemetry make this possible.

    The real power of observability emerges when these three pillars are correlated. When an alert fires on a metric, you can jump directly to related traces, then drill into the specific logs for that trace — all in a connected workflow. This is sometimes called the “three pillars plus correlation” model, and it’s what separates genuine observability platforms from simple monitoring tools.

    High-Cardinality Data and Why It Matters

    One of the most important — and often underexplained — aspects of observability is its handling of high-cardinality data. Cardinality refers to the number of unique values a field can have. User IDs, request IDs, IP addresses, and container IDs are all high-cardinality fields. Traditional monitoring tools struggle enormously with high-cardinality data because storing and querying millions of unique label combinations is computationally expensive.

    True observability platforms like Honeycomb, Lightstep (now ServiceNow Cloud Observability), and Grafana’s newer stack are specifically designed to handle high-cardinality queries. This allows you to ask questions like “show me all requests from users in the UK who used version 4.2.1 of the iOS app and experienced latency above 2 seconds in the last hour” — a query that would be impossible in most traditional monitoring setups but is exactly the kind of question you need answered during a complex incident.

    Observability vs Monitoring: A Direct Comparison

    Now that both concepts are defined, it helps to see their differences laid out clearly. Understanding where each approach excels — and falls short — is the key to building a smarter, more resilient engineering practice.

    Purpose and Philosophy

    Monitoring is built around known unknowns. You know your service might have high CPU usage, so you monitor CPU usage. You know your API might return 500 errors, so you alert on error rates. It’s a checklist approach to system health.

    Observability is built around unknown unknowns. It gives you the tooling and data richness to investigate problems you didn’t anticipate. It treats your system as something to be explored and understood, not just policed by predefined rules.

    Reactive vs Exploratory

    Monitoring is reactive — it tells you something crossed a threshold. Observability is exploratory — it gives you the ability to ask open-ended questions and follow threads of investigation wherever they lead. During a production incident, monitoring might wake you up, but observability is what helps you find the root cause in minutes instead of hours.

    Data Granularity

    Monitoring typically works with aggregated data. Your dashboard might show average response time over 5-minute windows. That’s useful for trend detection but terrible for understanding a specific user’s bad experience. Observability works with granular, per-request data, allowing you to examine individual events rather than statistical summaries.

    Scale of Complexity

    Monitoring scales well for simpler, more predictable architectures. A single database server, a monolithic web application, a small cluster — these are environments where monitoring alone can be sufficient. For distributed systems, serverless functions, event-driven architectures, and multi-cloud deployments, observability becomes non-negotiable. According to a 2026 Dynatrace State of Observability report, organizations with more than 20 microservices that relied on monitoring alone took an average of 4.3 hours longer to resolve critical incidents compared to teams using full observability platforms.

    Practical Implementation: Building a Strategy That Uses Both

    The important truth that many blog posts miss: observability and monitoring are not competing approaches. They’re complementary layers of your engineering practice. The goal is to use monitoring for the predictable stuff and observability for everything else — while making the two work together seamlessly.

    Start With Instrumentation

    Good observability begins with good instrumentation in your code. OpenTelemetry, now the industry standard for instrumentation, provides vendor-neutral SDKs for adding traces, metrics, and logs to applications written in virtually any language. In 2026, OpenTelemetry has become the default choice for most engineering teams, with over 60% of Fortune 500 companies having adopted it across at least some of their services according to CNCF adoption data.

    Practical steps for strong instrumentation:

    1. Add trace IDs to every request as it enters your system, and propagate that ID through every downstream service call
    2. Use structured logging so logs are machine-readable and can be correlated with trace IDs automatically
    3. Define Service Level Objectives (SLOs) and use your monitoring layer to alert on SLO burn rates rather than raw metric thresholds — this dramatically reduces alert fatigue
    4. Sample traces intelligently — head-based sampling for development, tail-based sampling for production to capture 100% of errors while reducing volume on healthy paths

    Choosing the Right Tools for Your Stack

    The tooling landscape in 2026 has matured significantly. Several platforms now offer comprehensive coverage across monitoring and observability:

    • Datadog: Mature, feature-rich, excellent for teams that want a single vendor solution. Strong monitoring capabilities with solid observability features added in recent years.
    • Grafana Stack (Loki, Tempo, Mimir): Open-source friendly, highly customizable, increasingly popular for teams that want control over their data pipeline.
    • Honeycomb: Purpose-built for observability with exceptional high-cardinality query support. Preferred by teams at the cutting edge of distributed systems.
    • AWS CloudWatch / Azure Monitor / Google Cloud Operations: Native cloud monitoring tools that work well for single-cloud environments and integrate tightly with managed services.
    • New Relic: Strong all-in-one platform with significant investments in AI-assisted root cause analysis.

    Don’t try to adopt everything at once. Start with solid monitoring fundamentals, add distributed tracing incrementally service by service, and build toward full observability as your team’s maturity grows.

    Building a Culture of Observability

    Perhaps the most underappreciated aspect of observability is that it’s as much a cultural shift as a technical one. Monitoring tends to create a reactive, alert-driven culture where engineers wait for problems to be flagged. Observability encourages a proactive, curious engineering culture where teams regularly explore system behavior, run pre-mortem analyses, and use production data to guide architectural decisions.

    Leading engineering organizations like Netflix, Shopify, and Cloudflare have published extensively about how shifting to observability-first thinking reduced mean time to resolution (MTTR) and improved developer confidence when shipping changes to production. The investment in tooling pays off fastest when teams actually change how they work — not just what tools they use.

    Common Pitfalls and How to Avoid Them

    Understanding the difference between observability vs monitoring is valuable only if you apply it correctly. Here are the most frequent mistakes teams make when trying to implement these practices:

    • Treating more dashboards as better observability: Dashboards are a monitoring artifact. More dashboards just mean more things to check during an incident. True observability means you can explore data freely without relying on pre-built views.
    • Neglecting trace propagation: If even one service in your stack drops the trace context header, your distributed traces break. Trace propagation must be treated as a critical engineering requirement, not an afterthought.
    • Alert fatigue from poorly defined thresholds: Teams that monitor everything and alert on every anomaly quickly learn to ignore alerts. Focus your monitoring on user-impacting signals and use SLO-based alerting to cut noise dramatically.
    • Skipping the “why” discipline: Teams that install observability tools but continue asking only “is it up or down?” never realize the full value. Train engineers to ask open-ended questions about system behavior during every incident review.
    • Underestimating data volume and cost: Full observability, particularly detailed distributed tracing, generates enormous data volumes. Plan your sampling strategy and storage architecture before going to production, not after your bill arrives.

    Frequently Asked Questions

    Is observability just a buzzword for advanced monitoring?

    No — though it’s understandable why people think so. Monitoring checks predefined conditions. Observability is a property of your system that allows you to understand its internal state through external outputs, including data types and cardinality levels that traditional monitoring tools can’t handle. They solve overlapping but fundamentally different problems.

    Do small teams or small applications need observability?

    Probably not immediately. For a simple monolithic application or a small team running a handful of services, solid monitoring with good logging is often sufficient. Observability investment pays off most clearly as system complexity grows. That said, instrumenting with OpenTelemetry from the start is low-cost and means you’re ready to adopt full observability when your system demands it.

    What is OpenTelemetry and why does it matter?

    OpenTelemetry is a CNCF project that provides vendor-neutral, open-source APIs, SDKs, and tooling for generating and collecting telemetry data — logs, metrics, and traces. It matters because it prevents vendor lock-in. By instrumenting your application once with OpenTelemetry, you can route your data to any backend — Datadog, Honeycomb, Grafana, or your own storage — without changing your application code. In 2026, it is the industry standard for telemetry instrumentation.

    Can I use Prometheus for observability?

    Prometheus is an excellent monitoring tool with strong metrics collection capabilities, but it is not an observability platform on its own. Its data model is not designed for high-cardinality data or distributed tracing. Many teams use Prometheus alongside Grafana Tempo for tracing and Loki for logs, creating an observability stack built from open-source components where Prometheus handles the metrics layer.

    How does AI fit into observability in 2026?

    AI and machine learning have become integral parts of modern observability platforms. Features like anomaly detection, automated root cause analysis, and intelligent alert correlation are now standard in platforms like Dynatrace, New Relic, and Datadog. These capabilities help reduce the cognitive load on engineers during incidents and can surface patterns in telemetry data that humans would never spot manually. However, AI augments observability — it doesn’t replace the need for good instrumentation and engineering discipline.

    What is the difference between MTTD and MTTR, and how do observability and monitoring affect them?

    MTTD stands for Mean Time to Detect — how long it takes to discover a problem. MTTR stands for Mean Time to Resolve — how long it takes to fix it. Monitoring primarily improves MTTD by alerting you quickly when thresholds are breached. Observability primarily improves MTTR by giving you the context and tooling to find root causes faster. Great engineering teams invest in both, minimizing the time between a problem starting and a fix being deployed.

    Where should I start if my team is completely new to observability?

    Start with three practical steps. First, ensure your existing monitoring is clean and actionable — eliminate noisy alerts and move toward SLO-based alerting. Second, adopt structured logging across all your services so logs are machine-readable and consistently formatted. Third, instrument one critical user-facing service with OpenTelemetry and set up a free or trial-tier tracing backend to see distributed traces in action. Learning by doing on a real system is far more effective than reading documentation alone.

    The line between observability vs monitoring will only become more important as systems grow more distributed and user expectations for reliability continue to rise. Teams that understand both concepts clearly — and invest in the right tools and culture for each — will ship faster, resolve incidents more quickly, and build fundamentally more reliable products. The engineering teams winning in 2026 aren’t choosing one over the other. They’re using monitoring as their early warning system and observability as their investigation superpower.

    Disclaimer: This article is for informational purposes only. Always verify technical information and consult relevant professionals for specific advice regarding your infrastructure, tooling choices, and engineering practices.

  • How to Pass the AWS Solutions Architect Exam in 2025

    How to Pass the AWS Solutions Architect Exam in 2025

    Why the AWS Solutions Architect Certification Still Matters in 2026

    Cloud computing now powers over 94% of enterprise workloads globally, and AWS holds the largest market share at 31% — making the AWS Solutions Architect certification one of the most valuable credentials a tech professional can earn today. Whether you’re pivoting into cloud architecture, pushing for a promotion, or simply future-proofing your career, passing the AWS Solutions Architect exam in 2025 and beyond is a goal worth pursuing seriously. This guide gives you a battle-tested, step-by-step roadmap to pass the exam with confidence.

    According to Global Knowledge’s IT Skills and Salary Report, AWS-certified professionals earn an average of $168,000 annually in the United States, ranking it consistently among the top-paying IT certifications worldwide. In the UK, Canada, Australia, and New Zealand, demand for certified AWS architects has grown by over 35% since 2023, driven by cloud migration projects across healthcare, finance, and government sectors.

    The exam isn’t easy — but it’s absolutely passable with the right strategy. Let’s break down everything you need to know.

    Understanding the AWS Solutions Architect Exam Structure

    Before you open a single study guide, you need to understand exactly what you’re preparing for. The AWS Solutions Architect certification comes in two tiers: Associate (SAA-C03) and Professional (SAP-C02). Most candidates start with the Associate level, and that’s what this guide primarily focuses on.

    AWS Solutions Architect Associate (SAA-C03) — The Fast Track

    The SAA-C03 exam consists of 65 questions, mostly scenario-based multiple choice, with a 130-minute time limit. You need a scaled score of 720 out of 1000 to pass. Amazon updates this exam version regularly, so always check the official AWS certification page to confirm the current exam guide before you study.

    The exam is divided into four domains:

    • Domain 1 — Design Secure Architectures (30%): Identity and access management, security controls, encrypted data storage, and VPC security.
    • Domain 2 — Design Resilient Architectures (26%): Highly available and fault-tolerant systems, decoupled architectures, and disaster recovery strategies.
    • Domain 3 — Design High-Performing Architectures (24%): Elastic and scalable compute, optimized storage, and efficient networking solutions.
    • Domain 4 — Design Cost-Optimized Architectures (20%): Cost-effective storage, compute, and database solutions using AWS pricing models.

    AWS Solutions Architect Professional (SAP-C02) — The Advanced Path

    The Professional exam is significantly harder. It features 75 questions, a 180-minute window, and requires deep knowledge of complex multi-account AWS environments, migrations, hybrid architectures, and organizational governance. Most candidates are advised to have at least two years of hands-on AWS experience before attempting this level.

    For the purposes of this guide, we’ll primarily focus on the Associate exam — the most common entry point and a powerful credential on its own.

    Building Your Study Plan: A Realistic Timeline

    One of the biggest mistakes candidates make is underestimating preparation time or overloading themselves with resources. A focused, structured study plan beats scattered binge-learning every time.

    How Long Does It Actually Take?

    According to AWS training data and community surveys on platforms like Reddit and A Cloud Guru, most candidates spend between 60 and 120 hours studying for the Associate exam. That translates to:

    • 6–8 weeks for full-time learners studying 2–3 hours daily
    • 10–12 weeks for part-time learners fitting in 1–2 hours around work
    • 4 weeks for experienced cloud professionals refreshing existing knowledge

    Be honest about your starting point. If you’ve never touched AWS before, start at week one with foundational cloud concepts. If you’ve been working with EC2 and S3 for two years, you can skip ahead to the gap-filling phase.

    Week-by-Week Study Framework

    Here’s a practical structure that thousands of successful candidates have followed:

    1. Weeks 1–2: Foundation Building. Complete a structured video course. Learn core AWS services — EC2, S3, RDS, IAM, VPC, Lambda, Route 53, CloudFront, and ELB. Understand the AWS Well-Architected Framework pillars.
    2. Weeks 3–4: Deep Dive by Domain. Work through each exam domain methodically. Use AWS documentation and whitepapers to fill knowledge gaps. Start hands-on labs — don’t skip this step.
    3. Weeks 5–6: Practice and Reinforce. Take full-length practice exams. Review every wrong answer thoroughly — not just what’s correct, but why the other options are wrong.
    4. Week 7–8: Final Polish. Simulate real exam conditions. Time yourself strictly. Focus on weak areas identified from practice scores. Book your exam date.

    The Best Resources for Passing the AWS Solutions Architect Exam

    Resource overload is a real problem in AWS exam prep. Here’s a curated, no-fluff list of what actually works.

    Video Courses Worth Your Time

    Not all video courses are created equal. The following have earned consistently strong pass rates among the community:

    • Stephane Maarek’s AWS SAA-C03 Course (Udemy): Widely regarded as the gold standard. Regularly updated, extremely thorough, and includes hands-on labs. Watch for Udemy sales — the course often drops to under $20.
    • Adrian Cantrill’s AWS Solutions Architect Course: More technical and in-depth than most competitors. Excellent for candidates who prefer a conceptual-first approach before drilling into AWS console work.
    • A Cloud Guru / Pluralsight: Good for beginners and offers sandbox AWS environments, which is invaluable for hands-on practice without racking up real AWS charges.

    Practice Exams — The Make-or-Break Resource

    Practice exams are arguably more important than any video course. They train your brain to think the way AWS exam questions are written — and the question style is very specific.

    • Tutorials Dojo (Jon Bonso): The most highly recommended practice exam resource in the AWS community. The explanations are detailed and closely mirror real exam difficulty.
    • Whizlabs: A solid secondary resource with a large question bank. Good for additional volume once you’ve exhausted Tutorials Dojo.
    • Official AWS Practice Questions: Available through AWS Skill Builder. Use these to get familiar with official question formatting.

    Aim to consistently score 80% or higher on practice exams before booking your real exam date. If you’re scoring 65–70%, keep drilling — don’t rush to test day.

    AWS Documentation and Whitepapers

    Many candidates skip the official whitepapers — and that’s a mistake. AWS recommends reading these key documents before your exam:

    • AWS Well-Architected Framework
    • AWS Storage Services Overview
    • Overview of Amazon Web Services
    • Disaster Recovery of Workloads on AWS

    You don’t need to memorize these cover to cover. Read them once, understand the core principles, and revisit relevant sections when practice exam questions reveal a knowledge gap.

    Hands-On Practice: The Skill That Separates Passers from Failers

    Reading and watching videos will only take you so far. The AWS Solutions Architect exam is scenario-based — it tests whether you can apply knowledge to real architectural decisions, not just recall definitions. Candidates who pass consistently report that hands-on practice in the AWS console is what made concepts click.

    Setting Up a Free AWS Practice Environment

    AWS offers a Free Tier account that gives you 12 months of limited free access to core services including EC2, S3, RDS, Lambda, and more. Create an account and commit to building things — not just watching someone else do it.

    Essential hands-on exercises for the Associate exam include:

    • Launch an EC2 instance, configure security groups, and connect via SSH
    • Create an S3 bucket, enable versioning, and configure lifecycle policies
    • Set up a VPC with public and private subnets, an internet gateway, and NAT gateway
    • Configure an Application Load Balancer with an Auto Scaling Group
    • Create IAM users, roles, and policies with least-privilege principles
    • Deploy a Lambda function triggered by an S3 event
    • Set up RDS with Multi-AZ deployment for high availability

    When you build these systems yourself, the exam questions about them become intuitive. You’ll recognize architectural trade-offs because you’ve experienced them firsthand.

    Cost Management During Practice

    One anxiety many learners have is accidentally running up AWS bills during practice. Set a billing alarm immediately after creating your account — AWS allows you to configure CloudWatch alerts that notify you when your estimated charges exceed a threshold (such as $10). Always terminate resources after practice sessions. Services like NAT Gateways and RDS instances can incur charges even when idle.

    Exam Day Strategy: How to Maximise Your Score

    Technical knowledge gets you ready for the exam. Smart test-taking strategy gets you over the finish line. Many candidates who know the material still underperform due to poor time management or misreading questions.

    How to Approach Scenario-Based Questions

    AWS exam questions are deliberately verbose. They include context, constraints, and sometimes red herrings. A proven technique is to read the question from the bottom up: read the last sentence first (what they’re actually asking), then read the scenario for relevant constraints, then evaluate the answer options.

    Key constraint words to watch for include:

    • “Least operational overhead” — points toward managed AWS services like RDS, Fargate, or DynamoDB over self-managed alternatives
    • “Most cost-effective” — think Reserved Instances, Spot Instances, S3 Intelligent-Tiering, or serverless architecture
    • “Highest availability” — think Multi-AZ, Auto Scaling, and Route 53 health checks
    • “Minimum downtime” — focus on blue/green deployments or Multi-AZ failover solutions

    Time Management During the Exam

    With 65 questions and 130 minutes, you have exactly two minutes per question. That sounds generous until you hit a complex scenario with five lengthy answer choices. Use this approach:

    1. Flag and skip any question you’re unsure about — don’t waste time agonizing
    2. Answer every question you’re confident about in the first pass
    3. Return to flagged questions with your remaining time
    4. Never leave a question blank — there’s no penalty for guessing

    On exam day, arrive early, bring valid ID, and if testing at a center, know that you can request scratch paper. The exam is also available online through Pearson VUE with remote proctoring, which many candidates prefer for comfort and flexibility.

    Booking and Scheduling Your Exam

    The AWS Solutions Architect Associate exam costs $150 USD (prices may vary slightly in other regions). Book through Pearson VUE via the AWS Certification portal. AWS occasionally offers exam vouchers through promotions, training completions, or re:Invent attendance — always check before paying full price.

    Set a firm exam date once you’re consistently scoring 80%+ on practice exams. Having a real deadline is one of the most powerful motivation tools available — it transforms vague “I should study” intentions into focused preparation.

    Frequently Asked Questions

    How hard is the AWS Solutions Architect Associate exam?

    The SAA-C03 exam is considered moderately difficult. It doesn’t require memorizing every AWS service in existence, but it does require strong conceptual understanding of core services and the ability to apply architectural best practices to realistic business scenarios. Most candidates with a structured study plan and genuine hands-on practice pass within their first or second attempt. The pass rate is not publicly disclosed by AWS, but community estimates suggest it hovers around 65–70% for prepared candidates.

    Do I need prior AWS experience to attempt the Associate exam?

    AWS recommends at least one year of hands-on experience with AWS, but this is a guideline, not a requirement. Many successful candidates have passed with zero professional AWS experience by completing a comprehensive video course, building projects in a free-tier account, and drilling practice exams thoroughly. Experience helps enormously — but motivated beginners absolutely pass this exam every day.

    How long is the AWS Solutions Architect certification valid?

    AWS certifications are valid for three years from the date you pass the exam. To maintain your certification, you must recertify before it expires either by passing the same exam again, passing a higher-level exam, or completing AWS’s continuing education requirements through AWS Skill Builder. AWS typically notifies you well in advance of your expiration date.

    What’s the difference between the Associate and Professional exams?

    The Associate exam (SAA-C03) focuses on core architectural concepts, individual service knowledge, and best practice application. The Professional exam (SAP-C02) goes significantly deeper — testing complex multi-account architectures, large-scale migrations, advanced networking, cost optimization at organizational scale, and governance frameworks. The Professional exam also features longer, more complex questions and typically requires 75–100+ hours of additional study beyond the Associate level. Most career paths benefit from starting with Associate before attempting Professional.

    Can I pass the AWS exam using only free resources?

    Yes, it’s possible — but harder. AWS Skill Builder offers free content including official practice questions, digital training, and exam readiness courses. AWS documentation and whitepapers are entirely free. YouTube hosts solid foundational AWS content. However, the best practice exam resources (Tutorials Dojo, Stephane Maarek’s course) cost money and significantly improve pass rates. If budget is a concern, prioritize paid practice exams over paid video courses, as the exam-taking practice is more directly impactful.

    How many times can I retake the exam if I fail?

    AWS allows unlimited retakes, but imposes a waiting period between attempts. After a failed attempt, you must wait 14 days before retaking. After each subsequent failure, the same 14-day waiting period applies. Each attempt requires paying the full exam fee again ($150 USD), so it’s strongly in your financial interest to prepare thoroughly before booking. Use a failed attempt as diagnostic data — review the domain breakdown in your score report and focus your retry preparation on weak areas.

    Is the AWS Solutions Architect certification worth it in 2026?

    Absolutely. Cloud adoption continues to accelerate across all industries, and AWS maintains its position as the dominant cloud platform globally. The certification signals to employers that you understand not just how to use AWS services, but how to architect reliable, secure, cost-optimized systems at scale — a skill set in serious demand. Whether you’re a developer looking to move into cloud architecture, a sysadmin transitioning to DevOps, or a student entering the job market, the AWS Solutions Architect certification delivers measurable career and salary impact backed by consistent market data.

    Passing the AWS Solutions Architect exam is one of the most high-return investments you can make in your technology career in 2026. The path is clear: choose one structured course, get your hands dirty in the AWS console, drill practice exams until you’re consistently hitting 80%, and book your exam date with confidence. Thousands of professionals across the United States, United Kingdom, Canada, Australia, and New Zealand have followed this exact approach and transformed their careers — and with the resources available today, there’s no reason you can’t join them. Start this week, stay consistent, and that certification badge will be yours sooner than you think.

    This article is for informational purposes only. Always verify technical information directly with AWS official documentation and consult relevant professionals for specific career or certification advice.

  • Cloud Native Development: What It Is and Why It Matters

    Cloud Native Development: What It Is and Why It Matters

    The Architecture Shift That’s Redefining How Software Gets Built

    Cloud native development is the modern approach to building and running applications that fully exploit the advantages of cloud computing — and in 2026, it has become the default standard for serious software teams worldwide.

    If you’ve been hearing terms like Kubernetes, microservices, containers, and DevOps thrown around in meetings and job descriptions but aren’t entirely sure how they connect, you’re not alone. Cloud native development brings all of these concepts together into a coherent philosophy. It’s not just about hosting your app on AWS or Azure — it’s about rethinking how software is designed, deployed, and scaled from the ground up.

    According to the Cloud Native Computing Foundation (CNCF), over 96% of organizations are either using or evaluating Kubernetes in production as of 2025, with adoption continuing to climb into 2026. Meanwhile, Gartner projects that more than 95% of new digital workloads will be deployed on cloud native platforms by 2026, up from less than 30% in 2021. These aren’t buzzword statistics — they represent a fundamental transformation in how the world’s software gets built and maintained.

    This guide breaks down what cloud native development actually means, why it matters for developers and businesses alike, and how you can start thinking and working in a cloud native way — whether you’re a developer, a technical decision-maker, or simply someone who wants to understand the modern software landscape.

    Breaking Down the Core Concepts

    Cloud native development is best understood not as a single technology, but as a set of principles and practices that work together. The CNCF defines cloud native technologies as those that “empower organizations to build and run scalable applications in modern, dynamic environments such as public, private, and hybrid clouds.” That definition is intentionally broad — and for good reason.

    Microservices Architecture

    Traditional applications were often built as monoliths — one large codebase where every feature was tightly coupled to every other feature. If the payment module had a bug, the whole application might go down. Cloud native development replaces this with microservices, where an application is broken into small, independent services, each responsible for a specific function.

    Think of an e-commerce platform. A cloud native version might have separate services for user authentication, product catalog, shopping cart, payment processing, and order notifications. Each service runs independently, communicates via APIs, and can be updated or scaled without touching the others. A spike in orders on Black Friday? Scale just the cart and payment services — not the entire application.

    Containers and Container Orchestration

    Containers are the packaging format that makes microservices practical. A container bundles an application and all its dependencies into a single lightweight, portable unit that runs consistently across any environment. Docker popularized containers, but the real magic happens when you start managing dozens or hundreds of them at once.

    That’s where Kubernetes comes in. Kubernetes is the industry-standard container orchestration platform that automates deployment, scaling, and management of containerized applications. It’s complex, but it solves genuinely hard problems — like automatically restarting failed containers, distributing traffic across healthy instances, and rolling out updates with zero downtime.

    DevOps and CI/CD Pipelines

    Cloud native development doesn’t just change the architecture of your application — it changes how your team operates. DevOps is the cultural and technical practice of breaking down silos between development and operations teams, enabling faster, more reliable software delivery. Continuous Integration and Continuous Deployment (CI/CD) pipelines automate the process of testing, building, and deploying code, so changes can go from a developer’s laptop to production in minutes rather than months.

    Declarative APIs and Infrastructure as Code

    In a cloud native environment, infrastructure is managed through code rather than manual configuration. Infrastructure as Code (IaC) tools like Terraform and Pulumi let teams define their entire infrastructure in version-controlled files. This means environments are reproducible, auditable, and consistent — eliminating the “it works on my machine” problem at the infrastructure level.

    Why Cloud Native Development Has Become Non-Negotiable

    The shift to cloud native isn’t driven by hype — it’s driven by business necessity. The pace at which companies need to ship software, respond to customer feedback, and scale their services has made traditional development models simply unworkable at scale.

    Speed and Agility at Scale

    Netflix, one of the earliest and most cited examples of cloud native architecture, deploys code thousands of times per day across hundreds of microservices. That level of velocity would be impossible with a monolithic architecture and manual deployment processes. For businesses competing in fast-moving markets, the ability to iterate quickly isn’t a luxury — it’s a survival requirement.

    Cloud native practices enable independent deployability, meaning different teams can release their services on their own schedules without coordinating a massive synchronized release. This dramatically reduces the organizational friction that slows software delivery in traditional setups.

    Resilience and Reliability

    Cloud native systems are designed to expect failure. Rather than building systems that try to prevent failure entirely (which is impossible at scale), cloud native architecture builds in redundancy, automatic failover, and self-healing capabilities. Kubernetes, for instance, will automatically detect an unhealthy container and replace it without human intervention.

    This approach — often called designing for failure — is why cloud native applications typically achieve much higher uptime than their monolithic counterparts. Chaos engineering practices, popularized by Netflix’s Chaos Monkey tool, take this even further by deliberately introducing failures in production to test and strengthen system resilience.

    Cost Efficiency Through Elasticity

    One of the most compelling business cases for cloud native development is cost optimization through elastic scaling. Traditional infrastructure required companies to provision for peak load, meaning they paid for maximum capacity even during quiet periods. Cloud native applications scale resources up and down dynamically based on actual demand.

    A retail application might run on minimal resources overnight and automatically scale to handle ten times the traffic during a flash sale — then scale back down and stop billing for those extra resources the moment demand drops. This pay-for-what-you-use model represents a fundamental shift in how technology costs are managed.

    Developer Experience and Talent Attraction

    There’s a less-discussed but equally important reason organizations move to cloud native: developer satisfaction. A 2024 DORA (DevOps Research and Assessment) report found that developers working in high-performing DevOps environments were 2.4 times more likely to recommend their organization as a great place to work. Modern developers want to work with modern tools, and cloud native practices — with their automation, clear ownership, and rapid feedback loops — are genuinely more enjoyable than wrestling with legacy deployment processes.

    The Cloud Native Technology Ecosystem in 2026

    The cloud native landscape has matured considerably over the past few years, and understanding the key tools and platforms gives you a practical map of the territory.

    The Major Cloud Providers

    Amazon Web Services (AWS), Microsoft Azure, and Google Cloud Platform (GCP) are the dominant cloud platforms, each offering comprehensive managed services for cloud native workloads. AWS leads in overall market share, while GCP’s deep roots in Kubernetes (Google invented it) give it particular strength in container-heavy environments. Azure has become dominant in enterprises heavily invested in Microsoft’s ecosystem.

    Each provider offers managed Kubernetes services — AWS EKS, Azure AKS, and Google GKE — that abstract much of the operational complexity of running Kubernetes yourself. For most teams, using a managed service is the right starting point.

    Service Mesh and Observability

    As microservices architectures grow more complex, managing communication between services becomes its own challenge. Service mesh technologies like Istio and Linkerd handle traffic management, security, and observability between microservices automatically, without requiring changes to application code.

    Observability — the ability to understand what’s happening inside your system from its outputs — is a cornerstone of cloud native operations. Tools like Prometheus for metrics, Grafana for visualization, Jaeger for distributed tracing, and the OpenTelemetry standard for instrumentation form the backbone of modern cloud native observability stacks.

    Serverless and Platform Engineering

    Serverless computing, through platforms like AWS Lambda, Azure Functions, and Google Cloud Run, takes cloud native abstraction even further by removing server management entirely. Developers write functions that execute in response to events, and the platform handles all infrastructure concerns automatically.

    In 2026, platform engineering has emerged as a discipline focused on building internal developer platforms (IDPs) that abstract cloud native complexity for application developers. Rather than requiring every developer to be a Kubernetes expert, platform teams build self-service portals and golden paths that let developers deploy and manage services without needing deep infrastructure knowledge.

    Getting Started with Cloud Native: A Practical Roadmap

    Understanding cloud native development conceptually is one thing — knowing where to begin practically is another. Whether you’re an individual developer or part of an organization considering a migration, the following roadmap provides a structured starting point.

    For Individual Developers

    • Learn Docker first. Before touching Kubernetes, get comfortable building, running, and managing Docker containers. Docker Desktop provides a local environment to experiment with, and Docker’s official documentation is excellent for beginners.
    • Build something small with microservices. Take a simple project you’ve already built — a REST API, a web app — and try breaking it into two or three independent services that communicate over HTTP. You’ll quickly discover the real challenges of distributed systems.
    • Get hands-on with Kubernetes. Minikube and kind (Kubernetes IN Docker) let you run a Kubernetes cluster locally. The CNCF’s free learning resources and Kelsey Hightower’s “Kubernetes the Hard Way” are go-to references for serious learners.
    • Understand CI/CD. Set up a simple GitHub Actions or GitLab CI pipeline that builds and tests your code automatically. Extend it to deploy to a staging environment. This muscle memory becomes invaluable.
    • Explore a cloud provider’s free tier. AWS, Azure, and GCP all offer free tiers with enough capacity to experiment with real cloud native services without spending money.

    For Organizations Considering Migration

    1. Assess before you migrate. Not every application needs to be cloud native. Run a structured assessment of your application portfolio — some legacy systems are fine where they are. Focus cloud native investment on applications that need speed, scale, or resilience.
    2. Start with the strangler fig pattern. Rather than rewriting everything at once, use the strangler fig approach — gradually replace pieces of a monolith with microservices while keeping the original system running. This reduces risk dramatically.
    3. Invest in platform engineering early. The cognitive load of cloud native tools is real. Building or adopting an internal developer platform early prevents developer burnout and accelerates adoption.
    4. Prioritize observability from day one. Distributed systems are harder to debug than monoliths. Instrumenting your services with proper metrics, logs, and traces from the beginning is far easier than retrofitting it later.
    5. Build a culture of shared ownership. Technology alone won’t make you cloud native. Teams need to own their services end-to-end — writing, deploying, monitoring, and being on-call for them. This accountability drives quality in ways that siloed development never can.

    Common Pitfalls and How to Avoid Them

    Cloud native development delivers tremendous benefits, but organizations that rush into it without preparation often create more complexity than they solve. Being aware of the most common mistakes is the first step to avoiding them.

    Microservices Premature Adoption

    One of the most repeated mistakes is breaking a small application into microservices before it’s ready. Microservices introduce genuine complexity — distributed transactions, network latency, service discovery, and operational overhead. For a team of three developers building a startup’s first product, a well-structured monolith is almost always the right choice. Migrate to microservices when you have clear scaling bottlenecks or team coordination problems that justify the added complexity.

    Neglecting Security in the Rush to Ship

    Cloud native environments expand the attack surface significantly. Container vulnerabilities, misconfigured Kubernetes RBAC, exposed API endpoints, and insecure secrets management are all real concerns. DevSecOps — integrating security practices directly into the CI/CD pipeline rather than treating them as an afterthought — is the cloud native approach to security. Tools like Snyk, Trivy, and Falco should be part of every cloud native pipeline.

    Underestimating Operational Complexity

    Running Kubernetes in production is not trivial. Teams that move to cloud native without investing in training, tooling, and operational processes often find themselves spending more time managing infrastructure than building product. Using managed services, investing in platform engineering, and building genuine operational expertise — rather than just copying configuration from tutorials — is the path to sustainable cloud native operations.


    Frequently Asked Questions

    What is the difference between cloud native and cloud-based development?

    Cloud-based development simply means your application runs on cloud infrastructure — it might be a traditional monolithic application hosted on a virtual machine in AWS. Cloud native development goes much further, designing the application itself to exploit cloud capabilities: elasticity, resilience, rapid deployment, and managed services. A cloud-based app is in the cloud; a cloud native app is built for the cloud from the ground up.

    Do I need to use Kubernetes to be cloud native?

    No — Kubernetes is a powerful and widely adopted tool, but it’s not a requirement for cloud native development. Serverless platforms like AWS Lambda or Google Cloud Run embody cloud native principles without requiring Kubernetes at all. The principles matter more than any specific tool: build for resilience, automate deployment, design for elasticity, and embrace managed services. Choose tools that fit your team’s scale and maturity.

    Is cloud native development only for large companies?

    Absolutely not. While companies like Netflix and Spotify popularized cloud native architecture at massive scale, the principles and tools are accessible and beneficial for organizations of all sizes. Startups in particular benefit from cloud native’s pay-as-you-scale economics and the speed of CI/CD pipelines. The key is adopting practices proportionate to your actual scale — a five-person team doesn’t need the same infrastructure complexity as a 5,000-person engineering organization.

    How long does it take to migrate a monolith to cloud native architecture?

    There’s no single answer — it depends heavily on the size and complexity of the application, the team’s existing cloud native skills, and how aggressive the migration strategy is. Small to medium applications might complete a migration in six to twelve months using the strangler fig pattern. Large enterprise monoliths can take three to five years to fully migrate. Many organizations choose to maintain hybrid architectures indefinitely, running some workloads as cloud native services while keeping stable legacy systems in place. Rushing the migration to hit an arbitrary deadline is a common cause of costly failures.

    What skills do developers need for cloud native development?

    Core cloud native skills include containerization with Docker, container orchestration fundamentals with Kubernetes, CI/CD pipeline configuration, infrastructure as code with tools like Terraform, and cloud provider fundamentals on at least one major platform. Beyond tools, strong fundamentals in distributed systems concepts — APIs, eventual consistency, fault tolerance, and observability — are essential. Soft skills matter too: cloud native teams are typically cross-functional and self-organizing, so communication and ownership mindset are genuinely important.

    What is GitOps and how does it relate to cloud native development?

    GitOps is a cloud native operational model where Git repositories serve as the single source of truth for both application code and infrastructure configuration. Any change to the system — a new deployment, a configuration update, an infrastructure change — is made through a pull request and merge, with automated tooling reconciling the live environment to match what’s declared in Git. Tools like ArgoCD and Flux implement GitOps for Kubernetes environments. It brings auditability, rollback capability, and consistency to cloud native operations, and has become a widely adopted best practice in 2026.

    Is cloud native development more expensive than traditional development?

    It depends on how you measure costs. The direct infrastructure costs of cloud native can be lower due to elastic scaling — you pay for what you use rather than provisioning for peak capacity. However, the tooling, training, and operational complexity introduce real costs. Organizations that invest properly in platform engineering and automation typically see strong ROI over time. Those that adopt cloud native tools without the supporting practices often find costs higher than expected. A careful total-cost-of-ownership analysis, accounting for developer productivity gains and reduced downtime, typically favors cloud native for applications that genuinely need its capabilities.


    Cloud native development represents more than a technical trend — it’s a fundamental reimagining of what software development looks like when you design for the realities of modern scale, speed, and reliability. The organizations and developers who invest in understanding and practicing cloud native principles today are building the technical foundation that will define competitive advantage for the next decade. Whether you’re writing your first Dockerfile or leading an enterprise-wide migration strategy, the cloud native journey rewards deliberate, principled progress over rushed adoption. Start small, build your understanding incrementally, and let the principles guide your tool choices — not the other way around.

    Disclaimer: This article is for informational purposes only. Always verify technical information and consult relevant professionals for specific advice regarding your infrastructure, security, and architectural decisions.

  • How to Set Up a DevOps Environment from Scratch

    How to Set Up a DevOps Environment from Scratch

    Why Most DevOps Setups Fail Before They Start

    Setting up a DevOps environment from scratch is one of the highest-leverage technical investments a development team can make — yet over 60% of organizations report their first DevOps initiative stalls within three months due to toolchain confusion, cultural misalignment, or poor foundational planning. Whether you’re a solo developer building your first pipeline or a team lead modernizing a legacy workflow, this guide walks you through every layer of a production-ready DevOps setup with clarity, precision, and zero guesswork.

    DevOps isn’t a tool — it’s a philosophy backed by tools. According to the 2025 State of DevOps Report by DORA (DevOps Research and Assessment), elite DevOps teams deploy code 973 times more frequently than low performers and recover from failures in under an hour. The gap isn’t talent — it’s infrastructure and process. Getting the foundation right is everything.

    Understanding the Core Pillars Before You Touch a Terminal

    Before you install anything, you need a mental model of what a DevOps environment actually consists of. Rushing to set up tools without understanding the architecture is the number one reason teams end up with fragile, unscalable pipelines.

    The Five Layers of a Modern DevOps Stack

    • Source Control: Where all code, configuration, and infrastructure definitions live — typically Git-based repositories.
    • CI/CD Pipeline: Automated systems that test, build, and deploy your code reliably and repeatedly.
    • Infrastructure as Code (IaC): Tools that let you define servers, networks, and cloud resources in version-controlled files.
    • Containerization and Orchestration: Docker for packaging applications and Kubernetes or similar tools for managing them at scale.
    • Monitoring and Observability: Systems that give you real-time visibility into your infrastructure, application performance, and errors.

    Each layer depends on the one beneath it. You can’t have a reliable CI/CD pipeline without a solid version control strategy. You can’t orchestrate containers effectively without first understanding how to containerize properly. Build in this sequence, and you’ll avoid the most common architectural mistakes teams make when they set up a DevOps environment from scratch.

    Choosing Your Operating Philosophy

    In 2026, most DevOps environments operate on one of three models: cloud-native (entirely on AWS, Azure, or Google Cloud), hybrid (mix of on-premise and cloud), or on-premise. For new setups, cloud-native is almost always recommended. The managed services available from major cloud providers dramatically reduce operational overhead and let your team focus on building rather than maintaining servers. Unless your organization has specific regulatory constraints, start cloud-native.

    Setting Up Version Control and Repository Strategy

    Every professional DevOps environment begins with a disciplined version control setup. Git is the universal standard — the question is how you structure your repositories and branching strategy.

    Choosing Between Monorepo and Polyrepo

    A monorepo houses all your services, libraries, and configurations in a single repository. A polyrepo gives each service its own repository. Companies like Google and Meta famously use monorepos, while many microservices-heavy organizations prefer polyrepos. For teams just starting out, a monorepo is often simpler to manage, easier to enforce standards across, and more compatible with modern CI/CD tooling like Nx, Turborepo, or Bazel.

    Branching Strategy That Scales

    The most battle-tested approach in 2026 is trunk-based development, where developers commit to a single main branch frequently (at least once per day), supported by short-lived feature branches. This approach dramatically reduces merge conflicts and is the branching strategy most associated with high-performing DevOps teams according to DORA research. Avoid long-lived branches — they are a primary cause of integration nightmares.

    • Use main as your production-ready branch at all times
    • Create feature branches that live no longer than one to two days
    • Use pull requests with mandatory code review before merging
    • Protect your main branch with required status checks from your CI pipeline

    Repository Hygiene Essentials

    Set up a meaningful .gitignore from day one, enforce commit message conventions (Conventional Commits is the current standard), and add a pre-commit hooks tool like Husky or pre-commit to run linting and basic tests before code even reaches the remote repository. These small habits prevent enormous technical debt down the road.

    Building Your CI/CD Pipeline Step by Step

    A well-designed CI/CD pipeline is the heartbeat of any DevOps environment. It automates testing, building, security scanning, and deployment — turning code into running software with minimal human intervention.

    Selecting the Right CI/CD Tool

    In 2026, the dominant CI/CD tools are GitHub Actions, GitLab CI/CD, Jenkins, CircleCI, and ArgoCD (for Kubernetes-native GitOps workflows). For teams already using GitHub, GitHub Actions is the natural starting point — it’s tightly integrated, highly configurable, and has an enormous ecosystem of reusable workflows. GitLab CI/CD is the superior choice if you want a fully integrated DevOps platform where your repo, CI, container registry, and security scanning live under one roof.

    Anatomy of a Production-Ready Pipeline

    A mature CI/CD pipeline moves through distinct stages in sequence. Each stage acts as a quality gate — if something fails, the pipeline stops and notifies the team before bad code can progress further.

    1. Trigger: A push or pull request to a monitored branch kicks off the pipeline automatically.
    2. Lint and Static Analysis: Code style and quality checks run in seconds, catching formatting errors and obvious bugs before they waste testing time.
    3. Unit and Integration Tests: Automated tests validate that your code behaves as expected in isolation and when integrated with dependencies.
    4. Security Scanning: Tools like Snyk, Trivy, or GitHub’s built-in Dependabot scan for known vulnerabilities in your code and dependencies. According to Gartner’s 2025 Application Security report, organizations that integrate security into their pipeline (DevSecOps) detect vulnerabilities 4.5 times faster than those that rely on post-deployment scanning.
    5. Build and Package: The application is compiled, containerized, or packaged into an artifact ready for deployment.
    6. Deploy to Staging: The artifact deploys to a staging environment that mirrors production as closely as possible.
    7. Smoke and End-to-End Tests: Basic functionality tests run against the staging deployment to confirm the application is working correctly at a system level.
    8. Deploy to Production: Either automatically (continuous deployment) or after manual approval (continuous delivery), the validated artifact reaches production.

    Environment Variables and Secrets Management

    Never hardcode secrets, API keys, or environment-specific configuration in your codebase. Use your CI/CD platform’s built-in secrets management (GitHub Actions Secrets, GitLab CI Variables) for pipeline secrets, and a dedicated secrets manager like HashiCorp Vault, AWS Secrets Manager, or Azure Key Vault for application-level secrets. This is non-negotiable from a security standpoint — exposed credentials in repositories are one of the leading causes of cloud security incidents.

    Containerization, Infrastructure as Code, and Orchestration

    Modern DevOps environments treat infrastructure like software — versioned, tested, and deployed through the same rigorous processes as application code. This section covers the three components that make your infrastructure reproducible and scalable.

    Containerizing Your Applications with Docker

    Docker remains the standard containerization technology in 2026, though alternatives like Podman are gaining traction in security-conscious environments. The key principles of a good Docker setup are keeping images small (use official minimal base images like Alpine or Distroless), building multi-stage Dockerfiles to separate build-time and runtime dependencies, never running containers as root, and tagging images with specific version numbers rather than relying on the latest tag in production.

    Store your container images in a private registry — Amazon ECR, Google Artifact Registry, or the GitLab Container Registry are all solid choices. Your CI/CD pipeline should automatically build and push a new tagged image on every successful merge to main.

    Infrastructure as Code with Terraform

    Terraform by HashiCorp is the most widely adopted IaC tool for cloud infrastructure, with OpenTofu (its open-source fork) rapidly growing in adoption since HashiCorp’s license change. Write your cloud resources — VPCs, databases, load balancers, Kubernetes clusters — as Terraform configuration files, store them in version control alongside your application code, and apply changes through your CI/CD pipeline rather than clicking around in a cloud console.

    Organize your Terraform code into modules for reusability, use remote state storage (AWS S3 with DynamoDB locking is the classic setup) to enable team collaboration, and always run a plan before an apply so you can review what changes will be made before they happen.

    Orchestration: Kubernetes for Scale

    If you’re running multiple services or need horizontal scaling, Kubernetes is the orchestration platform that powers the overwhelming majority of production DevOps environments today. For teams setting up Kubernetes for the first time, managed Kubernetes services dramatically reduce operational complexity — Amazon EKS, Google GKE, and Azure AKS all abstract away the complexity of managing control planes.

    Start with the basics: Deployments for running your application pods, Services for internal and external networking, ConfigMaps and Secrets for configuration, and Horizontal Pod Autoscalers to handle traffic spikes automatically. A GitOps tool like ArgoCD or Flux CD can manage your Kubernetes deployments declaratively — your cluster state is defined in Git, and the tool continuously reconciles the live cluster to match.

    Monitoring, Observability, and Incident Response

    A DevOps environment without robust monitoring is like flying blind. Observability — the ability to understand the internal state of your system from its external outputs — is the discipline that separates teams who find out about problems from users from teams who fix problems before users ever notice.

    The Three Pillars of Observability

    Modern observability is built on three data types working together:

    • Metrics: Numerical measurements over time — CPU usage, request rate, error rate, latency. Prometheus is the standard collection tool, and Grafana is the standard visualization layer. Together they form the most widely used open-source monitoring stack in production DevOps.
    • Logs: Structured records of events from your application and infrastructure. The ELK stack (Elasticsearch, Logstash, Kibana) or the more modern Loki with Grafana are popular choices. Always use structured (JSON) logging rather than plain text — it makes querying dramatically more powerful.
    • Traces: Distributed tracing follows a single request as it moves through multiple services, identifying where latency or failures occur. OpenTelemetry is the open standard for instrumentation, with Jaeger or Tempo as popular backends.

    Setting Up Alerting That Actually Works

    Poorly configured alerting is one of the most damaging things in a DevOps environment — teams that receive hundreds of low-quality alerts per day develop alert fatigue and start ignoring them. Build your alerting strategy around Service Level Objectives (SLOs): define what good looks like for your system (for example, 99.9% of requests complete in under 200ms), then alert only when you’re at risk of breaching that target. Route alerts to Slack, PagerDuty, or OpsGenie based on severity, with clear on-call rotation policies so nothing falls through the cracks.

    Runbooks and Post-Mortems

    For every production alert, there should be a corresponding runbook — a documented procedure for diagnosing and resolving that specific issue. Store runbooks in your wiki or documentation system and link to them directly from your alert notifications. After every significant incident, conduct a blameless post-mortem to identify what happened, why, what was done to resolve it, and what process or technical changes will prevent recurrence. This continuous improvement loop is what separates mature DevOps organizations from those perpetually fighting fires.

    Security, Compliance, and Cultural Practices That Make It Stick

    The technical setup is only half of a successful DevOps environment. Security must be embedded throughout — not bolted on at the end — and the cultural practices that enable DevOps to deliver its promised value require deliberate investment.

    DevSecOps: Shifting Security Left

    Shifting security left means integrating security checks as early as possible in the development lifecycle. In practice, this means running Static Application Security Testing (SAST) tools in your pre-commit hooks and CI pipeline, scanning container images for vulnerabilities before they’re pushed to your registry, enforcing least-privilege IAM policies for all service accounts, enabling audit logging on all cloud resources, and regularly reviewing and rotating access credentials.

    Access Control and Identity Management

    Implement role-based access control (RBAC) across your entire stack — your version control system, CI/CD platform, Kubernetes cluster, and cloud environment. No human should have standing administrative access to production. Instead, use just-in-time access tools that grant elevated permissions for a limited time window and require justification. For service-to-service communication, use short-lived tokens via tools like Vault’s dynamic secrets rather than long-lived static credentials.

    Building the DevOps Culture

    Technology alone cannot set up a DevOps environment that delivers results. The cultural shifts — shared ownership between development and operations, psychological safety to raise concerns and learn from failures, and a commitment to continuous improvement — are what actually drive the performance gains that DORA research consistently identifies. Invest in documentation, internal training, regular architecture reviews, and clear metrics that the entire team owns together. A DevOps environment is never “done” — it evolves continuously as your product, team, and technology landscape change.

    Frequently Asked Questions

    How long does it take to set up a DevOps environment from scratch?

    A basic DevOps environment with version control, a CI/CD pipeline, containerization, and foundational monitoring can be set up in one to two weeks for a small team with cloud-native tools. A production-grade environment with full observability, IaC, Kubernetes orchestration, and mature security practices typically takes two to four months to build and stabilize. The timeline depends heavily on team experience, the complexity of your application, and how many legacy systems you’re integrating.

    What is the best DevOps tool stack for a startup in 2026?

    For most startups in 2026, the recommended stack is GitHub for source control, GitHub Actions for CI/CD, Docker for containerization, AWS EKS or Google GKE for orchestration, Terraform or OpenTofu for IaC, and the Prometheus and Grafana stack for monitoring. This combination is well-documented, has large community support, integrates cleanly, and scales from startup to enterprise without requiring a full rewrite of your toolchain.

    Do I need Kubernetes to set up a DevOps environment?

    No — Kubernetes is powerful but not mandatory, especially for smaller teams or simpler applications. Many organizations run excellent DevOps environments on AWS ECS, Google Cloud Run, or Azure Container Apps, which provide containerized workload management without the operational complexity of managing Kubernetes. Introduce Kubernetes when your scaling requirements or microservices complexity genuinely justify it, not because it’s trendy. Premature adoption of Kubernetes is a common source of unnecessary complexity for early-stage teams.

    What is the difference between continuous delivery and continuous deployment?

    Continuous delivery means your pipeline automatically prepares a release-ready artifact and deploys it to staging, but a human approves the final push to production. Continuous deployment goes one step further — every change that passes all pipeline stages deploys to production automatically without human intervention. Continuous deployment requires high test coverage and confidence in your pipeline quality gates. Most teams start with continuous delivery and evolve toward continuous deployment as their test suite and pipeline maturity grows.

    How do I handle database migrations in a DevOps pipeline?

    Database migrations are one of the most nuanced parts of a DevOps pipeline. The best practice is to use a migration tool like Flyway or Liquibase, store migration scripts in version control alongside your application code, and run migrations as part of your deployment process before the new application version starts serving traffic. Always write backward-compatible migrations — changes that allow both the old and new version of your application to function simultaneously — to support zero-downtime deployments and easy rollbacks if something goes wrong.

    What monitoring metrics should I track first when starting out?

    Start with the four DORA metrics: deployment frequency, lead time for changes, change failure rate, and mean time to recovery. These give you a clear picture of your DevOps performance as a whole. At the infrastructure level, monitor the RED method for services: Rate (requests per second), Errors (error rate), and Duration (latency percentiles). For resource health, track CPU utilization, memory usage, and disk I/O. These foundational metrics will surface the vast majority of meaningful issues and give you a basis for setting realistic SLOs.

    Is DevOps suitable for small teams or solo developers?

    Absolutely — and in many ways, DevOps principles benefit small teams and solo developers more than large organizations, because the automation removes the operational burden that would otherwise require multiple dedicated roles. A solo developer with a well-configured CI/CD pipeline, automated testing, and containerized deployment can ship code with the reliability of a large engineering team. Start with the fundamentals: Git workflow, automated tests, and a basic pipeline. Add layers of complexity only as your project grows and the added tooling genuinely solves a problem you’re experiencing.

    Setting up a DevOps environment from scratch is an investment that compounds over time. Every automation you add, every test you write, and every process you document reduces toil, accelerates delivery, and makes your systems more resilient. The teams seeing the most dramatic results in 2026 are those that treat their DevOps environment as a product — continuously improving it, measuring its impact, and aligning it with business goals. Start with a solid version control strategy, build a reliable pipeline, containerize your applications, define your infrastructure as code, and instrument everything with observability tooling. That sequence, executed with discipline and iterated on with curiosity, is how you build a DevOps environment that genuinely transforms how your team ships software.

    Disclaimer: This article is for informational purposes only. Always verify technical information and consult relevant professionals for specific advice regarding your infrastructure, security requirements, and compliance obligations.

  • Linux for Developers: Essential Commands Every DevOps Engineer Needs

    Linux for Developers: Essential Commands Every DevOps Engineer Needs

    Why Linux Mastery Is the Foundation of Modern DevOps Work

    Linux powers over 96% of the world’s top one million web servers, making it the undisputed operating system of the cloud-native era — and for DevOps engineers, fluency in Linux commands is not optional, it’s survival.

    In 2026, the demand for DevOps professionals with deep Linux expertise continues to outpace supply. According to the Linux Foundation’s 2025 Open Source Jobs Report, 74% of hiring managers said Linux skills remain their top priority when evaluating candidates. Whether you’re managing containerized workloads on Kubernetes, automating CI/CD pipelines, or troubleshooting a production incident at 2 AM, your command-line confidence is what separates a good engineer from an exceptional one.

    This guide covers the essential Linux commands every DevOps engineer needs — organized by real-world use case, not alphabetical listing. If you’re new to the terminal or looking to sharpen your skills, this is your practical roadmap. Linux for developers isn’t just about memorizing syntax; it’s about understanding which tool to reach for when it matters most.

    Navigating the Filesystem Like a Pro

    Before you can automate anything, you need to move confidently through Linux directory structures. The filesystem is your map, and these commands are your compass.

    Core Navigation Commands

    • pwd — Prints your current working directory. Simple, but indispensable when scripts move you around.
    • ls -lah — Lists directory contents with human-readable sizes, hidden files, and detailed permissions. The flags matter: -l for long format, -a for all files, -h for human-readable sizes.
    • cd — Changes directory. Use cd – to jump back to your last location instantly — a small trick that saves real time.
    • find — Searches for files based on name, size, modification time, or permissions. Running find /var/log -name “*.log” -mtime -1 finds all log files modified in the last day.
    • locate — Faster than find for simple name lookups because it queries a prebuilt index. Update the index with updatedb.

    File Manipulation Essentials

    • cp -r — Copies directories recursively. Add -p to preserve file permissions and timestamps — critical when migrating config files.
    • mv — Moves or renames files. In scripts, always test your mv commands in dry-run mode first using echo to simulate the action.
    • rm -rf — Deletes files and directories forcefully and recursively. This is powerful and dangerous. Verify your path twice before running.
    • ln -s — Creates symbolic links, commonly used to point config files or binaries to versioned alternatives.
    • chmod and chown — Control file permissions and ownership. Running chmod 755 sets owner execute permissions while allowing group and world read/execute access.

    A practical tip: always use ls -la after changing permissions to confirm the result. Misconfigured file permissions are one of the most common causes of application failures in production environments.

    Process Management and System Monitoring

    DevOps engineers spend significant time understanding what a system is doing under the hood. Knowing how to inspect running processes, resource utilization, and system health is central to both proactive monitoring and reactive incident response.

    Process Visibility Commands

    • ps aux — Shows all running processes with user, CPU, and memory usage. Pipe it with grep to filter: ps aux | grep nginx.
    • top and htop — Real-time process monitors. htop offers a cleaner interface with mouse support and color-coded output. Install it with your package manager if it isn’t already present.
    • pgrep and pkill — Find or kill processes by name rather than PID. Far safer than hunting through ps output when you need to stop a specific service.
    • kill and killall — Send signals to processes. kill -9 forces immediate termination but should be a last resort since it doesn’t allow graceful shutdown.
    • nice and renice — Adjust process priority. Lower nice values mean higher CPU priority. Use this to deprioritize background jobs during peak traffic windows.

    System Resource Analysis

    • df -h — Displays disk space usage across mounted filesystems in human-readable format. Run this early when debugging slow deployments.
    • du -sh — Shows disk usage of a specific directory. du -sh /var/log/* quickly identifies bloated log directories.
    • free -m — Reports memory usage in megabytes. Look at the available column rather than free — Linux aggressively uses RAM for caching.
    • vmstat — Provides a snapshot of CPU, memory, swap, and I/O statistics. Running vmstat 1 5 samples every second for five intervals.
    • iostat — Part of the sysstat package, this monitors disk I/O performance. Essential for diagnosing database or storage bottlenecks.
    • uptime — Shows system load averages over one, five, and fifteen minutes. If the load average exceeds your CPU core count, your system is overloaded.

    According to a 2025 Datadog State of DevOps report, teams that proactively monitored system-level metrics resolved incidents 40% faster than those relying solely on application-level monitoring. Linux command-line tools are often your first and fastest diagnostic layer.

    Networking Commands That DevOps Engineers Use Daily

    Modern infrastructure is distributed by nature. Whether you’re debugging a failing API call, checking firewall rules, or inspecting DNS resolution, networking commands are part of the daily toolkit for Linux for developers working in DevOps roles.

    Connectivity and Diagnostics

    • ping — Tests basic reachability. Use ping -c 4 to limit output to four packets instead of running indefinitely.
    • traceroute / tracepath — Maps the path packets take to a destination, revealing where latency or packet loss occurs.
    • curl — Transfers data to or from a server using URLs. Invaluable for testing REST APIs: curl -I https://example.com returns headers only, useful for checking response codes without downloading content.
    • wget — Downloads files from the web, supports recursive downloads. Better than curl for batch file retrieval in scripts.
    • nslookup and dig — Query DNS records. dig +short A example.com returns only the IP address — clean and scriptable.
    • ss — The modern replacement for netstat. ss -tuln shows all listening TCP and UDP ports without resolving hostnames, which speeds up output on systems with many connections.

    Firewall and Port Management

    • iptables and nftables — Configure kernel-level firewall rules. Most modern distributions have moved toward nftables, but iptables knowledge remains essential for legacy systems.
    • ufw — Uncomplicated Firewall provides a simpler interface for managing iptables rules on Ubuntu-based systems. ufw allow 443/tcp opens HTTPS traffic in one command.
    • nc (netcat) — The Swiss Army knife of networking. Test if a port is open with nc -zv hostname 22 before assuming SSH is the issue.
    • tcpdump — Captures and analyzes network packets. Use tcpdump -i eth0 port 80 to capture HTTP traffic on a specific interface.

    Text Processing, Logs, and Automation

    In DevOps, logs tell the story of everything that went wrong — and everything that almost went wrong. Knowing how to search, filter, transform, and act on text output is arguably the most high-value skill set in Linux for developers.

    Text Searching and Filtering

    • grep — Searches for patterns in files or output. grep -r “ERROR” /var/log/ recursively searches all logs. Add -i for case-insensitive matching.
    • awk — Processes columnar data. awk ‘{print $1, $4}’ access.log extracts the IP address and timestamp from a web server log.
    • sed — Stream editor for find-and-replace operations. sed -i ‘s/old_value/new_value/g’ config.conf edits files in place — the -i flag modifies the original.
    • cut — Extracts specific fields from delimited text. Faster than awk for simple column extraction.
    • sort and uniq — Sort output and deduplicate lines. sort | uniq -c | sort -rn is a classic pipeline for finding the most frequent entries in a log file.
    • wc -l — Counts lines. Pipe any output into it to get a quick count of matching results.

    Log Management Commands

    • tail -f — Follows a log file in real time. Use tail -f /var/log/syslog during deployments to watch system events as they happen.
    • journalctl — Queries systemd’s journal. journalctl -u nginx –since “1 hour ago” scopes output to a specific service and time window.
    • less — Pages through large files without loading them into memory. Always prefer less over cat for large log files.
    • zcat and zgrep — Work with compressed log files directly without decompressing them first — saves disk I/O on busy servers.

    Shell Scripting Basics That Accelerate DevOps Work

    Automation starts with shell scripts. Even a basic Bash script that checks disk usage and sends an alert can save hours of manual monitoring. Key patterns every DevOps engineer should know include: using set -euo pipefail at the top of scripts to exit immediately on errors, using $( ) for command substitution, and using cron for scheduling recurring tasks via crontab -e.

    A 2024 Stack Overflow Developer Survey found that Bash and shell scripting remain among the top five most-used languages among DevOps and SRE professionals globally, reinforcing that these are career-long skills, not entry-level stepping stones.

    SSH, Security, and Remote Access Essentials

    Managing remote servers securely is a core responsibility. These commands protect access, enable secure file transfers, and help you audit what’s happening on systems you may never physically touch.

    SSH Configuration and Usage

    • ssh user@host — Establishes a secure remote shell. Use -p to specify a non-standard port and -i to specify an identity file.
    • ssh-keygen — Generates SSH key pairs. Always use Ed25519 keys in 2026 — they’re faster and more secure than older RSA 2048-bit keys.
    • ssh-copy-id — Installs your public key on a remote server’s authorized_keys file, enabling passwordless login.
    • scp and rsync — Transfer files securely. rsync is superior for large transfers because it only copies changed bytes and supports resuming interrupted transfers.
    • ssh-agent and ssh-add — Manage key authentication in memory so you don’t re-enter passphrases repeatedly during a session.

    Security Auditing Commands

    • last and lastb — Show recent logins and failed login attempts respectively. Run these after any suspected unauthorized access event.
    • who and w — Show who is currently logged in and what they’re doing. Useful during live incident response.
    • sudo -l — Lists the sudo privileges for the current user. Always verify sudo permissions after provisioning a new server.
    • auditctl and ausearch — Part of the Linux Audit framework. Configure audit rules to track file access, privilege escalation, and system calls for compliance and forensics.
    • fail2ban-client status — Checks the status of fail2ban jails, which automatically block IPs with repeated failed authentication attempts.

    Security misconfigurations remain the leading cause of cloud infrastructure breaches in 2026 according to the Verizon Data Breach Investigations Report. Command-line auditing skills are your first layer of defense before expensive security tooling enters the picture.

    Package Management and Environment Configuration

    Software installation, version management, and environment configuration are everyday tasks. Knowing the right package manager commands for your distribution prevents dependency conflicts, version drift, and the dreaded “works on my machine” problem.

    Distribution-Specific Package Managers

    • apt (Debian/Ubuntu) — Use apt update before apt upgrade to refresh package lists before installing updates. apt list –installed shows all installed packages.
    • yum and dnf (RHEL/CentOS/Fedora) — dnf is the modern successor to yum with better dependency resolution. dnf history shows a complete log of package changes.
    • snap and flatpak — Distribution-agnostic package formats that bundle dependencies. Useful for developer tools but come with additional resource overhead.

    Environment and Variable Management

    • export — Sets environment variables for the current session and child processes. Add exports to ~/.bashrc or ~/.bash_profile to make them persistent.
    • env and printenv — Display current environment variables. env | grep PATH quickly shows your executable search path.
    • which and whereis — Locate executables. which python3 tells you exactly which binary runs when you type that command — essential when managing multiple Python versions.
    • alias — Creates command shortcuts. Defining alias k=kubectl in your bashrc saves thousands of keystrokes across a working week.

    Frequently Asked Questions

    What Linux distribution should a DevOps engineer learn first?

    Ubuntu LTS (Long Term Support) is the most practical starting point in 2026. It has the largest community, extensive documentation, and is widely used in cloud environments on AWS, GCP, and Azure. Once you’re comfortable with Ubuntu, transitioning to RHEL-based systems like Amazon Linux or Rocky Linux is straightforward because the core Linux commands remain identical — only the package manager and some default configurations differ.

    How long does it take to become proficient with Linux commands for DevOps?

    With daily hands-on practice, most engineers reach functional proficiency within three to six months. The key is deliberate practice — not just reading commands but using them in real or simulated environments. Set up a local virtual machine using VirtualBox or WSL2 on Windows, and practice every command covered in this article. The Linux Foundation offers structured learning paths that typically take 40 to 80 hours to complete for foundational certification.

    Are Linux command line skills still relevant with so many GUI-based DevOps tools available?

    Absolutely, and arguably more relevant than ever. GUI tools like Kubernetes dashboards, CI/CD interfaces, and cloud consoles abstract the command line — but they always have limits. When something breaks in production, you will inevitably drop to a terminal. Engineers who understand what’s happening at the command-line level debug faster, write better automation, and build more resilient systems. GUI tools are acceleration layers, not replacements for foundational knowledge.

    What is the difference between a shell script and a Linux command?

    A Linux command is a single executable program or built-in function you run at the terminal — like ls, grep, or curl. A shell script is a text file containing a sequence of those commands, executed as a program by the shell interpreter (typically Bash). Shell scripts let you combine commands with logic — conditionals, loops, functions, and error handling — to automate multi-step workflows. Most DevOps automation starts as a shell script before graduating to more powerful tools like Ansible, Terraform, or Python.

    Which Linux commands are most important for Kubernetes and container management?

    For container-focused DevOps work, the most critical Linux commands involve namespace management, cgroup inspection, and networking tools. Specifically: nsenter for entering container namespaces for debugging, cgroups monitoring via /sys/fs/cgroup, iptables for understanding Kubernetes networking rules, lsns for listing active namespaces, and strace for tracing system calls within containers. Understanding these underlying Linux primitives makes Kubernetes far less mysterious because containers are ultimately Linux namespaces and cgroups with a management layer on top.

    How do I remember so many Linux commands?

    You don’t need to memorize everything — you need to recognize patterns. Focus on the twenty most frequently used commands first and internalize their flags through daily use. Use the man command (manual pages) religiously: man grep, man awk, man ssh all provide complete official documentation offline. Build a personal cheatsheet in a text file or Notion document and add to it every time you learn something new. The combination of frequent use and active documentation means most commands become muscle memory within weeks.

    Should I learn vim or nano as a terminal text editor?

    Learn the basics of both, but prioritize vim. Nano is immediately intuitive and perfectly adequate for quick edits. However, vim is available on virtually every Linux system by default and is significantly more powerful for editing configuration files, writing scripts, and navigating large files efficiently. You don’t need to become a vim expert — knowing how to open a file, enter insert mode, make changes, save, and quit (:wq) is enough to get you through most production scenarios. The investment in learning vim basics pays compound returns over an entire engineering career.


    Mastering Linux for developers is a career-defining investment. The commands covered in this guide — from filesystem navigation and process management to networking, log analysis, and security auditing — form the practical vocabulary every DevOps engineer uses daily. The engineers who excel in 2026 and beyond aren’t just those who know the tools; they’re the ones who understand why each tool exists and can reach for the right one instinctively under pressure. Start with the commands most relevant to your current work, practice them in real environments, and expand systematically. Linux expertise isn’t a destination you reach — it’s a compounding skill that grows more valuable with every server you touch, every incident you resolve, and every automation you build.

    Disclaimer: This article is for informational purposes only. Always verify technical information and consult relevant professionals for specific advice related to your infrastructure, security requirements, or organizational policies.

  • How to Build a Scalable Architecture on AWS for Startups

    How to Build a Scalable Architecture on AWS for Startups

    Why Most Startups Get AWS Architecture Wrong From Day One

    Building a scalable architecture on AWS for startups is the single most important technical decision you’ll make — and getting it wrong early can cost you millions in rework, downtime, and lost customers. According to a 2026 Flexera State of the Cloud report, 82% of enterprises and startups using AWS cite cost optimization and scalability as their top cloud challenges. The good news? With the right foundation, AWS gives startups a level playing field that previously only enterprises could afford.

    The mistake most early-stage teams make isn’t using the wrong AWS services — it’s building for today’s traffic instead of tomorrow’s growth. A system that works beautifully at 100 users often collapses spectacularly at 100,000. This guide walks you through the exact architectural patterns, services, and decisions that let you start lean, scale fast, and avoid the technical debt that kills promising startups before they hit their stride.

    The Foundation: Core Principles Before You Write a Single Line of Infrastructure

    Before touching the AWS console, successful engineering teams align on a set of non-negotiable principles. These aren’t abstract ideals — they’re decisions that directly affect which services you choose and how they connect.

    Design for Failure, Not Uptime

    AWS’s own Well-Architected Framework — updated in 2026 to include generative AI workload guidance — emphasizes one truth above all: assume everything will fail. Every component, every network connection, every availability zone can go down. Your architecture should treat failure as a routine event, not an exception. This means using multiple Availability Zones (AZs) from day one, building retry logic into every service call, and using managed services that handle infrastructure failures automatically rather than maintaining your own servers.

    Decouple Everything You Can

    Tightly coupled systems fail together and scale together — both of which are expensive. When your user authentication service is bundled with your payment processor and your recommendation engine, a bug in one component can bring down all three. Decoupling through queues, event buses, and APIs means individual components can scale independently and fail in isolation. This is the architectural foundation that separates startups that survive viral traffic spikes from those that don’t.

    Infrastructure as Code From the Start

    Manually clicking through the AWS console is fine for experimentation. It’s catastrophic for production. Using AWS CloudFormation or the more developer-friendly AWS CDK (Cloud Development Kit) means your entire infrastructure is version-controlled, repeatable, and reviewable. A 2026 survey by HashiCorp found that teams using Infrastructure as Code deploy 43% more frequently and recover from failures 3x faster than those managing infrastructure manually.

    Building Your Scalable AWS Stack: The Essential Services

    Knowing which AWS services to use — and just as importantly, which to skip until you need them — is what separates experienced cloud architects from teams burning cash on complexity they don’t need yet. Here’s the practical stack for a startup building a scalable architecture on AWS.

    Compute: Start Serverless, Add Containers Strategically

    For most startups in 2026, the compute journey looks like this: begin with AWS Lambda for event-driven workloads and APIs, graduate to Amazon ECS (Elastic Container Service) with Fargate when you need persistent processes or more predictable performance, and consider Amazon EKS (Elastic Kubernetes Service) only when your team has the DevOps maturity to justify it.

    Lambda is compelling for early-stage startups because you pay per invocation, not per idle server. But it has cold start limitations and a 15-minute execution cap. For anything running longer than that — video processing, machine learning inference, or background jobs — containerized workloads on ECS Fargate give you the flexibility of containers without managing EC2 instances directly. Many startups combine both: Lambda handles API requests and lightweight triggers while Fargate runs the heavy lifting.

    Database Architecture: The Right Store for the Right Job

    One of the most common and expensive mistakes in startup AWS architecture is using a single database for everything. Modern applications need different data stores for different purposes:

    • Amazon Aurora Serverless v2 for relational data — it scales compute automatically and costs nothing when idle, making it ideal for early-stage startups with unpredictable traffic.
    • Amazon DynamoDB for high-throughput key-value access patterns — think user sessions, real-time leaderboards, and event streams where single-digit millisecond latency is non-negotiable.
    • Amazon ElastiCache (Redis) for caching frequently accessed data, dramatically reducing database load and improving response times.
    • Amazon OpenSearch Service for full-text search capabilities, rather than hammering your relational database with complex LIKE queries.

    You don’t need all of these on day one. Start with Aurora Serverless for most use cases and introduce specialized stores when a specific pain point demands it. Premature optimization is a real danger — but so is architecting yourself into a corner with a single database that can’t support your product’s growth.

    Networking and Content Delivery

    Your Virtual Private Cloud (VPC) design determines how securely and efficiently your services communicate. A well-structured VPC separates public-facing resources (load balancers, API gateways) from private resources (databases, internal services) using public and private subnets. Place your databases in private subnets with no direct internet access — a step many startups skip and later regret when a misconfiguration exposes sensitive data.

    Amazon CloudFront, AWS’s global content delivery network, should be in front of virtually everything user-facing. In 2026, CloudFront operates from over 600 points of presence worldwide, meaning users in Sydney, London, and Toronto get assets served from nearby edge locations rather than your origin server. For a global startup audience, this alone can reduce page load times by 40-60% depending on geographic distribution of your users.

    API Management and Event-Driven Communication

    Amazon API Gateway handles routing, authentication, rate limiting, and throttling for your APIs without requiring you to build or maintain those systems yourself. Pair it with AWS WAF (Web Application Firewall) to protect against common exploits like SQL injection and cross-site scripting at the edge, before malicious traffic ever reaches your backend.

    For internal service communication, Amazon SQS (Simple Queue Service) and Amazon EventBridge are your core decoupling tools. SQS queues buffer work between services — if your order processing service gets overwhelmed, the queue absorbs the spike while your consumers work through it at a sustainable pace. EventBridge enables event-driven architectures where services react to events rather than calling each other directly, reducing coupling dramatically.

    Scaling Strategies That Actually Work Under Real Traffic

    Scalable architecture on AWS for startups isn’t just about choosing the right services — it’s about configuring them to respond to real-world demand patterns automatically and cost-effectively.

    Auto Scaling: Horizontal First, Always

    Vertical scaling (making one server bigger) is the lazy architect’s answer. It works until it doesn’t, and the failure modes are catastrophic — when your single large instance goes down, everything goes down. Horizontal scaling (adding more instances) distributes both traffic and failure risk. AWS Auto Scaling groups, combined with Application Load Balancers, handle this automatically. You define minimum, desired, and maximum instance counts, set scaling policies based on CPU utilization or custom metrics, and let AWS handle the rest.

    For containerized workloads, ECS Service Auto Scaling and Kubernetes Horizontal Pod Autoscaler (on EKS) offer similar capabilities at the container level. The key insight: scale out aggressively on the way up, scale in conservatively on the way down. Traffic spikes are sudden; unnecessary costs are gradual.

    Caching as a Scalability Multiplier

    Nothing reduces database load — and therefore cost — as effectively as a well-implemented caching strategy. The hierarchy typically looks like this: CloudFront caches static assets and API responses at the edge; API Gateway caching reduces Lambda invocations for repeated identical requests; ElastiCache (Redis) caches expensive database query results in memory; and application-level caching handles frequently accessed configuration and reference data.

    The critical discipline here is cache invalidation — knowing when to expire or refresh cached data. A cache that serves stale product prices or outdated user permissions is worse than no cache at all. Define your cache TTLs (time-to-live) carefully, and use event-driven invalidation for data that changes in response to specific user actions.

    Observability: You Can’t Scale What You Can’t See

    AWS CloudWatch provides metrics, logs, and traces across your entire AWS infrastructure. But raw CloudWatch data is overwhelming without structure. Implement structured logging (JSON-formatted logs with consistent fields), use CloudWatch Container Insights for containerized workloads, and set up AWS X-Ray for distributed tracing so you can follow a single user request across Lambda functions, databases, and external APIs.

    Define your key business metrics — not just technical ones. Track things like successful orders per minute, user registration conversion rate, and API error rates by endpoint. Set CloudWatch alarms on these metrics and connect them to SNS topics that notify your team via Slack or PagerDuty. In 2026, AWS also offers Amazon DevOps Guru, an ML-powered service that detects operational anomalies before they become outages — genuinely useful for lean startup engineering teams without a dedicated SRE.

    Security and Cost Optimization: The Two Things That Sink Startups

    Security and cost are rarely exciting topics until they become emergencies. An AWS bill that unexpectedly hits $50,000 in a month — a scenario that happens with alarming regularity to poorly instrumented startups — can end a company. And a security breach at scale destroys customer trust in ways that are nearly impossible to recover from.

    Security Non-Negotiables for AWS Startups

    • Enable AWS Organizations and Service Control Policies from day one to enforce security guardrails across all accounts.
    • Use IAM roles, never IAM users with long-lived credentials — especially for EC2 instances, Lambda functions, and ECS tasks. Credentials that don’t expire can’t be compromised through rotation failures.
    • Enable AWS GuardDuty — it’s a managed threat detection service that monitors for unusual API activity, potential account compromises, and cryptocurrency mining behaviors. At roughly $1-3 per month for small workloads, it’s the cheapest security investment you’ll make.
    • Encrypt everything — AWS KMS (Key Management Service) handles encryption key management for S3, RDS, EBS, and most other services. Enable encryption at rest and in transit everywhere without exception.
    • Enable AWS Config to continuously audit your resource configurations against security best practices and compliance rules.

    Keeping AWS Costs Under Control

    Set up AWS Budgets alerts immediately — before you do anything else. Configure alerts at 50%, 80%, and 100% of your monthly budget so surprises are impossible. Use AWS Cost Explorer weekly to understand which services and which teams are driving spend. Tag every resource with environment, project, and team tags from the start; without tags, cost attribution becomes impossible as your infrastructure grows.

    For compute costs specifically: use Savings Plans (not Reserved Instances, which are less flexible) for predictable baseline workloads, and use Spot Instances for fault-tolerant batch processing workloads where interruption is acceptable. AWS Spot Instances offer up to 90% savings over On-Demand pricing — genuinely transformative for data processing and ML training workloads that a startup can’t otherwise afford to run at scale.

    A Practical Roadmap: From MVP to Scale

    The best scalable architecture on AWS for startups is one that evolves deliberately rather than reactively. Here’s a phased approach that matches your infrastructure investment to your actual stage of growth.

    Phase 1: MVP (0–1,000 Users)

    Keep it simple. Use a single AWS account, Lambda for APIs, Aurora Serverless for your database, S3 and CloudFront for static assets, and Cognito for authentication. Your entire infrastructure should fit in a single CloudFormation or CDK stack. Focus your engineering time on product, not infrastructure. Monthly AWS costs at this stage should be under $200.

    Phase 2: Early Growth (1,000–100,000 Users)

    Introduce separate AWS accounts for production and staging using AWS Organizations. Add ElastiCache for caching, SQS for async processing, and implement proper VPC architecture with public and private subnets. Set up CI/CD pipelines using AWS CodePipeline or GitHub Actions with OIDC authentication to AWS. Add CloudWatch dashboards and alarms. Consider ECS Fargate if Lambda limitations are causing pain. Monthly costs might range from $500 to $5,000 depending on workload.

    Phase 3: Scale (100,000+ Users)

    This is where architectural decisions made in Phase 1 either pay dividends or create painful rework. Teams that decoupled services, used Infrastructure as Code, and built proper observability can scale horizontally with minimal friction. Introduce dedicated database read replicas, more sophisticated caching layers, multi-region failover if your SLAs demand it, and DynamoDB for high-throughput access patterns. Engage an AWS Solutions Architect — Amazon offers free architectural reviews through the AWS Well-Architected Tool that can save significant cost and risk at this stage.


    Frequently Asked Questions

    What is the best AWS architecture for a startup with limited budget?

    Start with a serverless-first approach using AWS Lambda, API Gateway, Aurora Serverless v2, S3, and CloudFront. This stack costs almost nothing at low traffic — you pay only for actual usage, not idle infrastructure. Cognito handles authentication cheaply, and DynamoDB’s free tier covers substantial early-stage usage. The total monthly cost for a pre-revenue startup can genuinely be under $50 while still using enterprise-grade, globally distributed infrastructure.

    How many AWS accounts should a startup use?

    At minimum, use separate accounts for production and non-production environments, managed under AWS Organizations. This prevents development activity from affecting production security controls and billing. A common startup structure is three accounts: a management/billing account, a production account, and a staging/development account. Avoid running everything in a single account — a misconfiguration in development can have catastrophic blast radius if production lives in the same account.

    Should startups use Kubernetes (EKS) from the beginning?

    Almost never. Kubernetes is powerful, but it comes with significant operational overhead that most startup engineering teams can’t justify before achieving product-market fit. Start with Lambda for event-driven workloads and ECS Fargate for containerized services — Fargate provides container orchestration without managing the underlying infrastructure. Graduate to EKS when you have a dedicated platform engineering team, complex multi-service dependencies, or specific Kubernetes-native tooling requirements.

    How do I prevent surprise AWS bills as a startup?

    Set up AWS Budgets alerts before deploying anything to production — configure alerts at 50%, 80%, and 100% of your expected monthly spend. Enable Cost Anomaly Detection in AWS Cost Explorer, which uses machine learning to flag unusual spending patterns and notify you before costs spiral. Tag all resources religiously with team and environment tags. Audit your AWS Cost Explorer weekly, not monthly. And be especially careful with data transfer costs — egress from AWS to the internet is where many startups encounter unexpected charges.

    What is the AWS Well-Architected Framework and should startups use it?

    The AWS Well-Architected Framework is Amazon’s own set of architectural best practices organized across six pillars: operational excellence, security, reliability, performance efficiency, cost optimization, and sustainability. It’s absolutely worth using — AWS provides a free Well-Architected Tool in the console that guides you through structured reviews of your architecture against these pillars. For startups, running a review before each major architectural decision or scaling milestone can surface risks and optimization opportunities that your team might miss when moving fast.

    How do I design for multi-region availability on AWS without huge costs?

    Full active-active multi-region architecture is expensive and complex — most startups don’t need it until they have contractual SLA obligations or a genuinely global user base with latency-sensitive requirements. Instead, design for single-region high availability first: multiple Availability Zones, automated failover, and recovery time objectives you can meet with Route 53 health checks and failover routing. If you need geographic distribution for performance rather than redundancy, CloudFront’s global edge network handles most use cases without multi-region backend deployment. Consider multi-region only when your RTO (Recovery Time Objective) requirements can’t be met within a single region.

    Which AWS database service should a startup choose first?

    Amazon Aurora Serverless v2 is the right default choice for most startups. It’s PostgreSQL and MySQL compatible (so your developers use familiar tools), scales compute capacity automatically in fine-grained increments, and pauses when idle — meaning you pay almost nothing during development and low-traffic periods. If your access patterns are primarily key-value with very high throughput requirements, consider DynamoDB instead. Avoid self-managed databases on EC2 instances; the operational overhead of patching, backup management, and high-availability configuration is time your startup engineering team can’t afford to spend.


    Building a scalable architecture on AWS for startups isn’t a one-time project — it’s an ongoing discipline of making deliberate trade-offs between simplicity, cost, and resilience at each stage of your growth. The startups that get this right share a common trait: they invest in solid foundations early (Infrastructure as Code, decoupled services, proper observability), resist the temptation to over-engineer before product-market fit, and evolve their architecture thoughtfully as real user data reveals where the actual scaling challenges live. AWS provides every tool you need to compete with infrastructure that would have cost millions to build a decade ago. The competitive advantage now belongs to teams that use those tools wisely, not lavishly.

    Disclaimer: This article is for informational purposes only. Always verify technical information and consult relevant professionals for specific advice regarding your startup’s infrastructure, security, and cloud architecture decisions.